
Churn vs. Expansion Revenue: The B2B SaaS Tradeoff Math

Most revenue plans treat churn and expansion as separate dials: turn churn down and expansion up, and growth follows. The ARR math says otherwise. Both levers pull on the same number, every dollar allocated to one carries an opportunity cost in the other, and the question worth taking to the board is harder than either dial. Given where your retention sits today, which lever generates more compounding return per dollar invested?
We answer this question for growth-stage and PE-backed SaaS companies in every engagement, and the numbers surprise finance and revenue teams more often than not. The tradeoff runs on financial mechanics: the formulas, the verified benchmarks, the hidden costs on both sides, and the decision framework CFOs and CROs use to pressure-test resource allocation before the next board meeting.
Gross churn, net churn, and NRR: the terms the tradeoff runs on
Teams use churn to mean at least three different numbers, and loose definitions lead to misallocated spend.
Gross churn measures the percentage of recurring revenue lost to cancellations, non-renewals, and downgrades: churned ARR divided by beginning ARR. It tells you how much of the existing base you lost in the period, and nothing about whether expansion covered the loss.
Net revenue churn subtracts expansion ARR from churned ARR before dividing by beginning ARR. When expansion exceeds losses, the number goes negative. Negative net churn is the compounding engine behind the best-performing SaaS businesses.
Net Revenue Retention unifies both into the number boards govern by: beginning ARR, minus churn and contraction, plus expansion, divided by beginning ARR. Above 100%, the installed base grows without a single new logo. Every allocation decision across churn and expansion shows up in NRR, which is why it belongs at the center of the capital allocation conversation. The current B2B SaaS median sits at 108% (SaaS Capital 2025), a shift we analyzed in 108% is the new NRR median.
The churn side: a lost dollar costs more than the ledger shows
When a $50K account churns, the P&L records a $50K loss. The business absorbs more. Sales has to replace the revenue with a new logo, and the median cost of acquiring $1.00 of new logo ARR runs $2.00, with bottom-quartile companies paying $2.82 (Benchmarkit 2025). Replacing $50K of churned ARR consumes roughly $100K of sales and marketing spend before a single dollar of net growth registers.
Our Churn Tax framework quantifies the full cost: the lost recurring revenue, the expansion those customers would have generated, and the acquisition spend required to replace them. The total runs 1.5 to 2.5x the reported churn rate. At $300M ARR with 9% gross churn, the direct loss is $27M, and the full Churn Tax runs $40.5M to $67.5M annually. Across a three-year horizon, the exposure compounds past $120M at the bottom of the range. We published the full model in The Churn Tax: The Full Cost Your Churn Rate Hides.
Each point of unfixed gross churn taxes sales capacity, with quota spent replacing revenue the company already earned once.
The expansion side: cheaper dollars, on one condition
Expansion revenue costs half of new logo revenue. The median Expansion CAC Ratio is $1.00 per dollar of expansion ARR versus $2.00 for new logos (Benchmarkit 2025). Retained revenue costs far less than both: median CS spend of 8% of ARR (SaaS Capital 2025) against 90%+ GRR implies $0.08 to $0.10 per retained dollar. We broke down these unit economics, and the budget imbalance they expose, in The Capital Allocation Problem.
The installed base already carries the growth load at scale. B2B SaaS companies generate 40% of total new ARR from existing customers, and above $50M ARR the share exceeds 50% (Benchmarkit 2025). Yet fewer than 20% of B2B SaaS companies measure their Expansion CAC Ratio (Benchmarkit 2025), and most underinvest in a motion they don't measure.
A second cost hides on this side of the tradeoff. We call it the Expansion Gap: revenue your retained customers stood ready to spend with you and didn't, because no motion existed to capture it. The Churn Tax measures what leaves, the Expansion Gap measures what never arrives, and together they define the distance between your current NRR and your attainable NRR.
The condition: expansion economics only hold on a stable retention base.
When NRR hides the tradeoff
A strong expansion motion running on top of high gross churn looks healthy in NRR until you decompose the number.
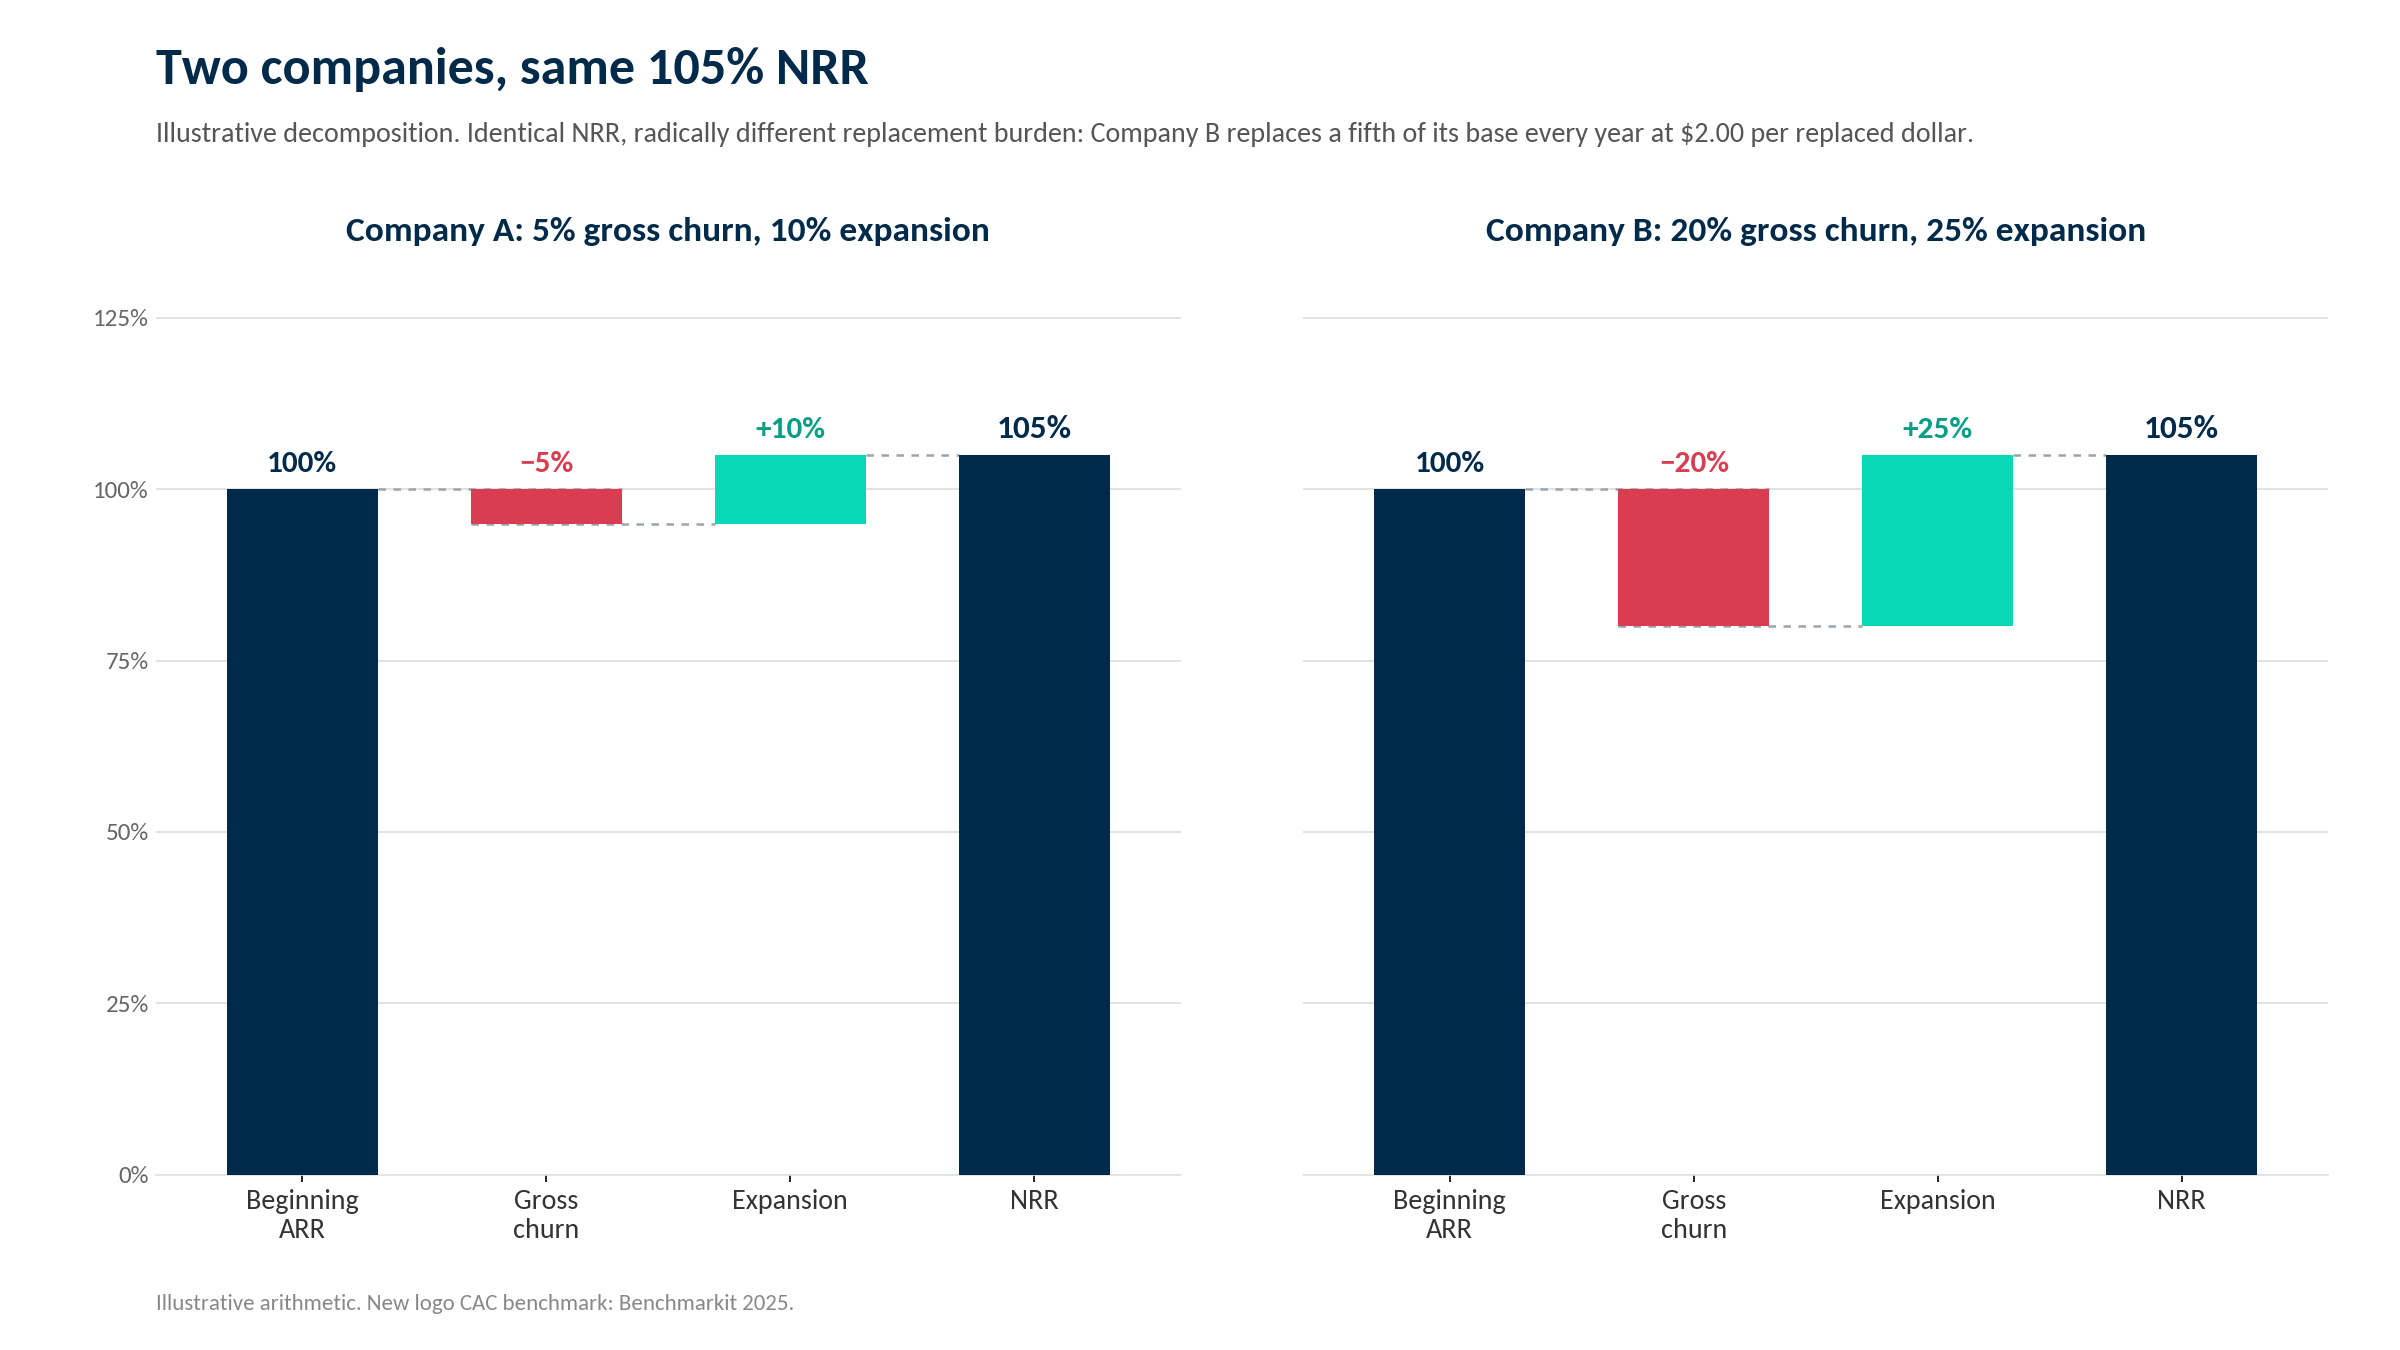
Illustrative math: 20% gross churn with 25% expansion produces 105% NRR. So does 5% gross churn with 10% expansion. Same headline, two different businesses. The first replaces a fifth of its revenue base every year at $2.00 per replaced dollar. The second compounds.
We saw this decomposition play out in public financials when we applied the Churn Tax framework to two publicly traded SaaS companies using their disclosed numbers. JFrog's Churn Tax came to 7.5% of ARR. Domo's came to 53.8%. The same framework in the same metric environment surfaced opposite retention realities, and NRR alone showed none of it. The full analysis is in Applying the Churn Tax to Public SaaS.
If your gross retention sits below the benchmark for your segment, expansion spend replaces revenue rather than compounding it. The capital flows to the wrong motion.
The decision framework for CFOs and CROs
The churn vs. expansion tradeoff is a capital allocation decision, and it deserves the same rigor as any other investment with a calculable ROI. Four questions locate you on the curve before anyone builds a model:
Where does your gross revenue retention sit against your segment benchmark?
What is your full Churn Tax: lost ARR, forfeited expansion, and replacement acquisition cost, compounded over three years?
What is your expansion rate as a percentage of beginning ARR, and what does each expansion dollar cost against each new logo dollar?
Are your highest-value accounts showing churn signals, expansion signals, or neither, and is your post-sale coverage aligned to those segments?
The fourth question does more work than it appears to. Retention focus belongs on high-risk, high-value accounts, identified through declining usage, engagement levels and financial signals. Expansion targeting belongs on low-risk, high-engagement accounts showing intent: growing teams, deepening product adoption, new budget events. Running expansion plays on at-risk accounts, or retention plays on growth-ready ones, wastes the spend and the relationship at the same time.
With those answers in hand, the model follows a clear structure: quantify the three-year compounding cost of current churn, model the revenue impact of a 2-to-3-point gross churn improvement at your ARR base, and compare it against a 10-point expansion rate improvement priced at your actual unit economics. In most modeled scenarios at growth and scale stage, the gross churn improvement generates the higher return. Run the numbers on your specific ARR base, growth rate, and CAC to produce a defensible board-level case.
The decision rule
If gross revenue retention sits below your segment benchmark, fix the retention floor while funding a new expansion motion. If gross churn sits at or below benchmark, expansion investment compounds on a stable base and deserves the incremental dollar. If your NRR sits in the ambiguous middle, run the diagnostic before the investment decision. Funding expansion programs without quantifying the retention floor is the most common misallocation we see in B2B SaaS revenue strategy, and the most expensive one.
FAQ: churn vs. expansion tradeoffs
What are churn vs. expansion tradeoffs in B2B SaaS?
The allocation decision between investing to protect existing revenue and investing to grow revenue from existing customers. Retaining a dollar of ARR costs $0.08 to $0.10, expanding a dollar costs $1.00, and replacing a churned dollar with a new logo costs $2.00 at median (Benchmarkit 2025, SaaS Capital 2025). The tradeoff has a financial answer, and it depends on where your gross retention sits against your segment benchmark.
When should a SaaS company prioritize expansion over churn reduction?
When gross churn already sits at or below the benchmark for your segment. Expansion compounds on a stable retention base. Layered over elevated churn, it masks a structural problem, and the cost surfaces once you model three-year ARR compounding.
How do you calculate the full cost of churn?
Start with lost ARR, add the expansion revenue those customers would have generated, then add the sales and marketing spend required to replace the revenue with new logos at roughly $2.00 per dollar (Benchmarkit 2025). The total runs 1.5 to 2.5x the reported churn rate. Model it over three years to capture the compounding.
Run the math before the next revenue plan
Churn and expansion are two sides of one compounding equation, and generic advice about reducing churn or investing in expansion won't tell you which side deserves the next dollar. Your ARR base, your gross retention, and your current allocation decide, and you already have the inputs to run the math.
Phase 1 of our Revenue Success Program is the diagnostic built for this decision. It sizes both sides of the tradeoff, your Churn Tax on the retention side and your Expansion Gap on the growth side, combined into NRR Opportunity Sizing with a prioritized, sequenced path to close the distance. You see the number, the components, and the investment case before committing budget to either motion.