The Capital Allocation Problem: SaaS Companies Overspend on Acquisition and Underinvest in Retention

A $300M ARR company running 9% gross churn is losing $27M in recurring revenue per year. The total Churn Tax on the loss, including forfeited expansion and replacement cost, runs $36M to $38M per year.
The same company spends $40M to $65M (Source: SaaS Capital 2025 Survey and Benchmarkit 2025) per year on sales and marketing to acquire new customers. A meaningful portion of the spend isn't growth. It's backfill: the cost of replacing revenue from customers who already trusted the product and left because the company didn't invest in keeping them.
The budget stays lopsided year after year, even when leadership knows the numbers. We've covered the math, churn is expensive, the question is structural.
The Most Expensive Dollar of Revenue
New logo revenue is the most expensive revenue a SaaS company generates. It carries the full weight of marketing spend, SDR teams, AE compensation, solution engineering, legal review, additional sales costs, and implementation onboarding. At growth-stage SaaS companies, the blended cost of acquiring $1 of new logo ARR runs $1.50 to $2.00 at median, with bottom quartile companies paying $2.82 per dollar of new logo ARR (Source: Benchmarkit 2025 SaaS Performance Metrics Report), depending on segment and sales motion. Enterprise deals with 9-12 month sales cycles push the number higher.
Expansion revenue from existing customers costs roughly half of new logos. The median expansion CAC ratio is $1.00 per dollar of expansion ARR versus $2.00 for new logo ARR (Source: Benchmarkit 2025).
Retained revenue costs even less. Based on median CS spend of 8% of ARR (Source: SaaS Capital 2025) and 90%+ GRR, the implied cost of retaining a dollar of existing ARR runs $0.08 to $0.10. Compare it to $2.00 for a new logo dollar and $1.00 for an expansion dollar. The figure includes the loaded cost of the CSM, the tooling, and the operational infrastructure.
Three categories of revenue with a 20x cost difference between the most expensive and the cheapest. Most GTM budgets allocate as if they're all the same.
Budget Allocation at a Typical $300M ARR Company
Pull a GTM budget at a $300M ARR company growing 20% year over year. The allocation pattern looks like this:
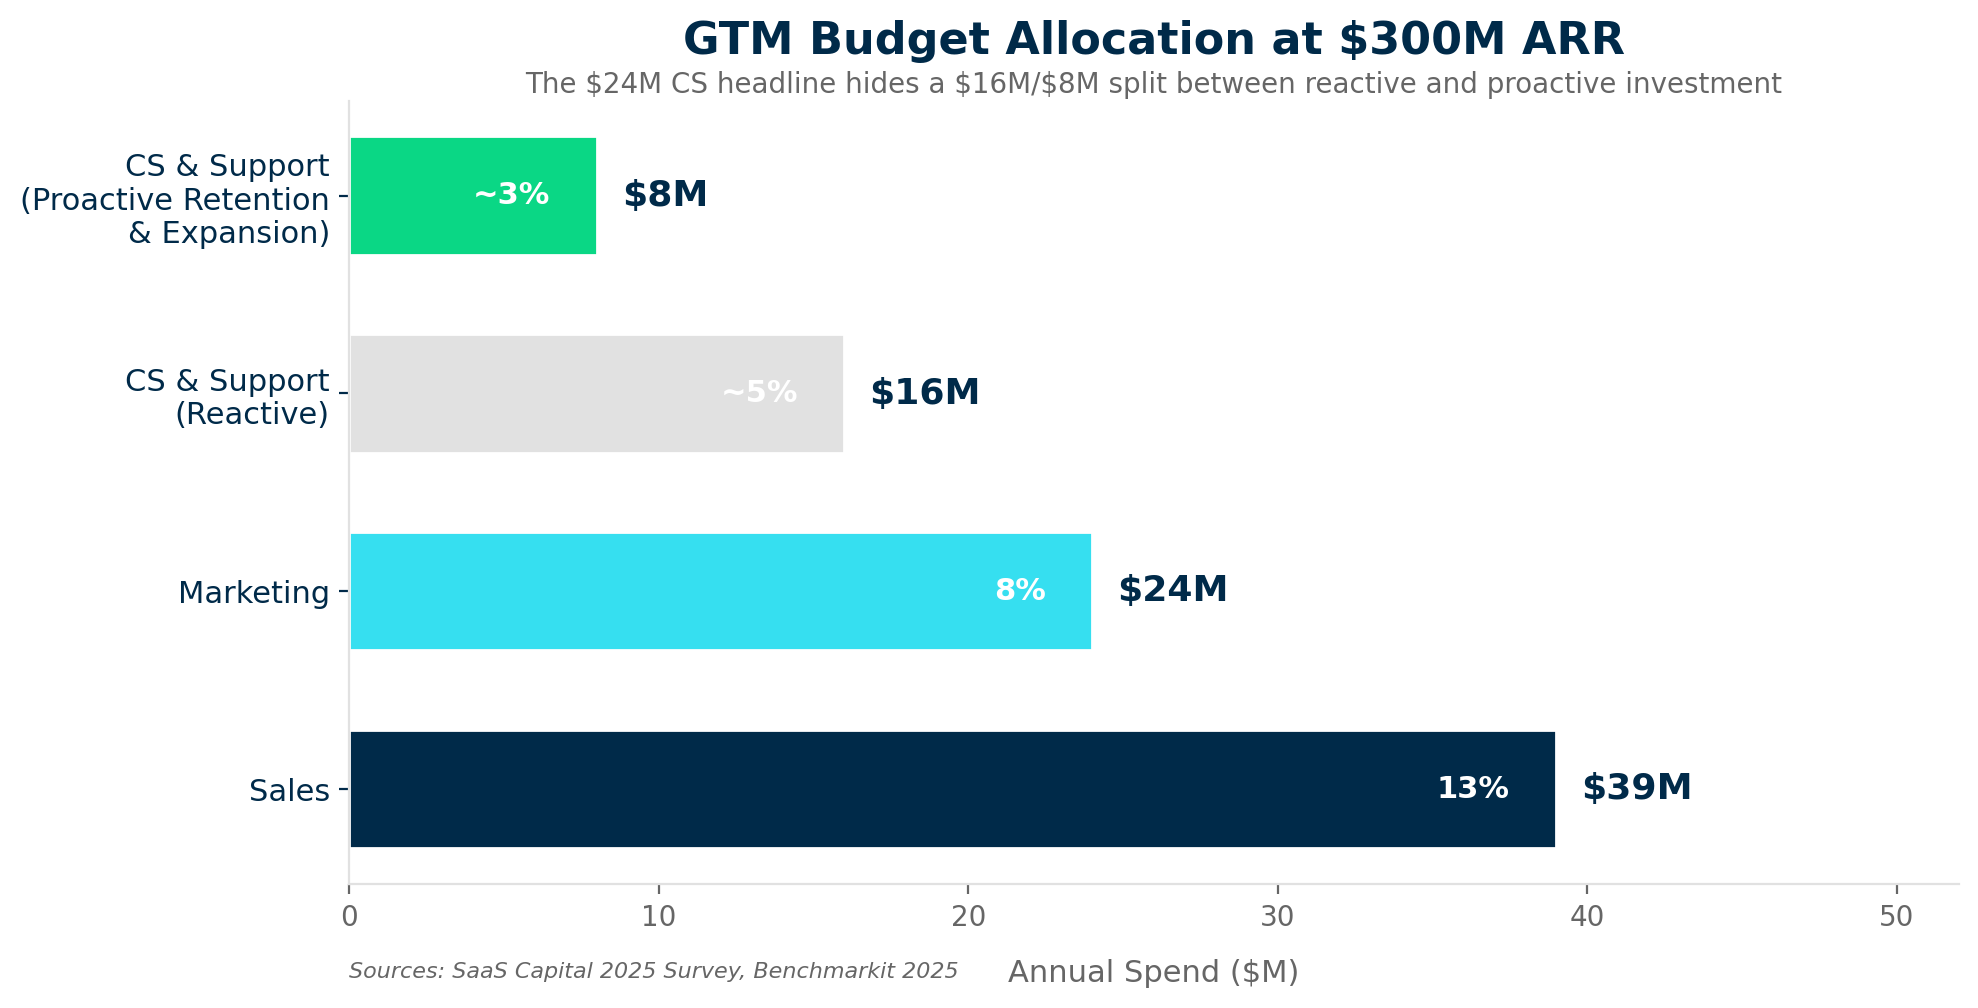
The headline numbers look balanced, they aren't.
Sales and marketing spend is allocated to new logo acquisition.
CS spend is allocated to reactive support and renewal processing.
Less than a quarter of the CS budget at most companies funds proactive retention and expansion motions.
The effective investment in protecting and growing existing revenue is closer to $6M-$8M, not $24M.
Three Structural Reasons the Imbalance Persists
Leadership isn't ignoring the problem. The imbalance persists for three structural reasons unrelated to whether anyone values retention.
Acquisition costs are visible. Retention costs are hidden.
Sales headcount shows up on one line. Marketing spend shows up on another. Pipeline tools, SDR teams, event budgets, all tracked, attributed, and reported quarterly. When the board asks "how much are we spending on growth," the answer is precise.
The cost of churn doesn't have a line item. It's distributed across the P&L: the sales commission on the replacement deal, the implementation cost of onboarding a new customer to replace a churned one, the marketing spend generating the lead for the replacement, the opportunity cost of expansion revenue the churned customer would have generated. No one adds those up, and no one reports them as a single number. The Churn Tax framework exists because this cost is real, substantial, and systematically undercounted.
The planning cycle rewards acquisition.
Annual budget planning starts with a growth target. The board says: grow 25%. The CRO builds a bookings plan to deliver 25% growth, the marketing team builds a demand gen plan to feed the bookings target. Headcount plans follow, budget follows headcount.
Retention enters the conversation as a constraint, not an investment. The CFO asks: "what's our churn assumption?" The answer goes into the model as a static percentage. No one asks the cost of moving the percentage down by 2 points, or the revenue impact of the improvement over 3 years.
Churn is treated as weather. Acquisition is treated as strategy.
This planning process directs incremental dollars toward acquisition. Equity-backed SaaS companies spend 89% more on sales and 100% more on marketing than their bootstrapped peers, while spending 14% more on Customer Success (Source: SaaS Capital 2025). The growth dollars flow to new logos.
Attribution models favor new logos.
SaaS companies have built sophisticated attribution infrastructure for acquisition. They track touchpoints from first ad impression to closed deal. Marketing ROI is measured in pipeline generated and deals influenced. Sales productivity is measured in quota attainment and bookings per rep.
Retention and expansion have no equivalent attribution infrastructure at most companies. When a customer renews, who gets credit? When a CSM identifies an upsell opportunity and passes it to sales, who influenced the deal? Fewer than 20% of B2B SaaS companies measure their Expansion CAC Ratio (Source: Benchmarkit 2025). If you don't measure the return on retention investment, you don't fund it at the same level.
The Reallocation Math
A $300M ARR company shifting 10-15% of its acquisition budget toward retention and expansion changes the unit economics of the entire GTM engine.
The starting point: understanding the unit economics by revenue source. The median cost to acquire $1 of new logo ARR is $2.00 (Source: Benchmarkit 2025). Bottom-quartile companies pay $2.82. The median cost to generate $1 of expansion ARR from existing customers is $1.00 (Source: Benchmarkit 2025). The implied cost of retaining $1 of existing ARR, derived from median CS spend of 8% of ARR (Source: SaaS Capital 2025) against 90%+ GRR, runs $0.08 to $0.10.
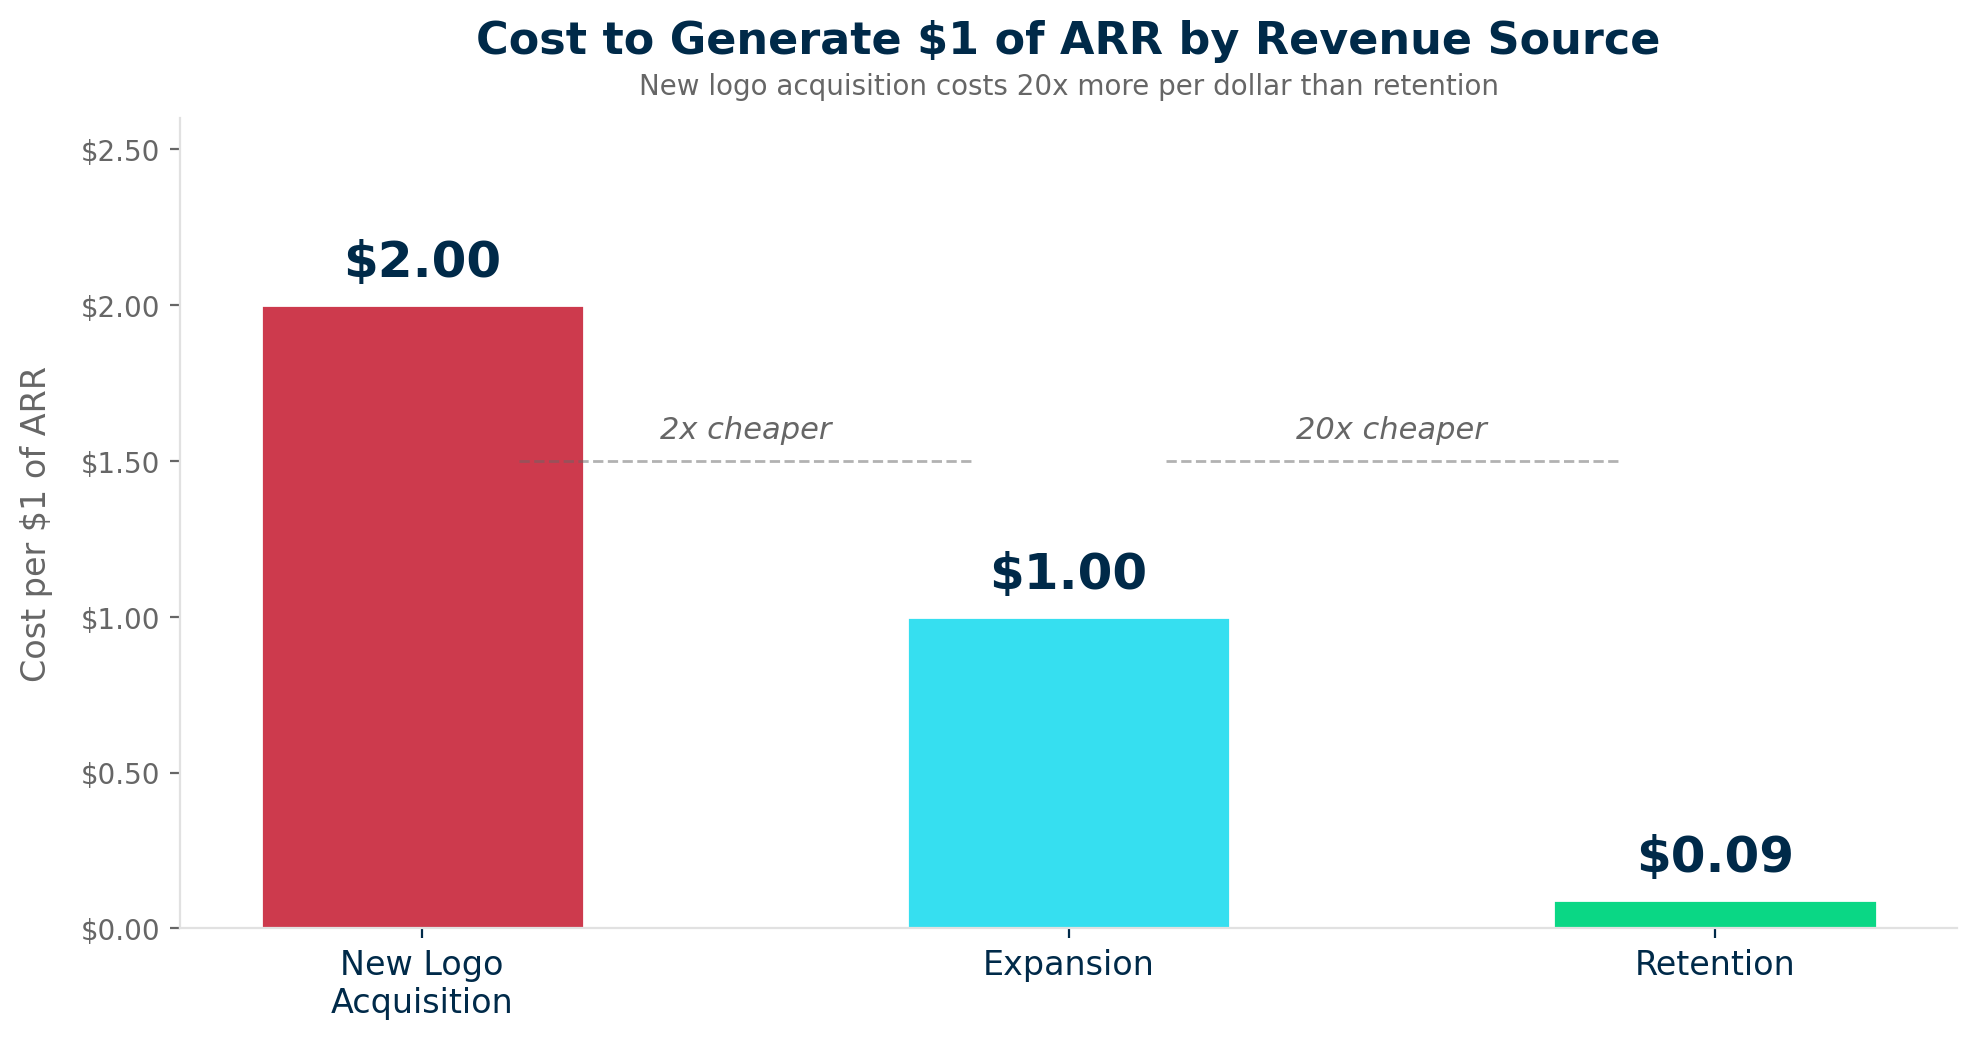
Three revenue sources. A 20x cost difference between the most expensive (new logos) and the cheapest (retention).
Scenario: $300M ARR, 9% gross churn, 20% growth target
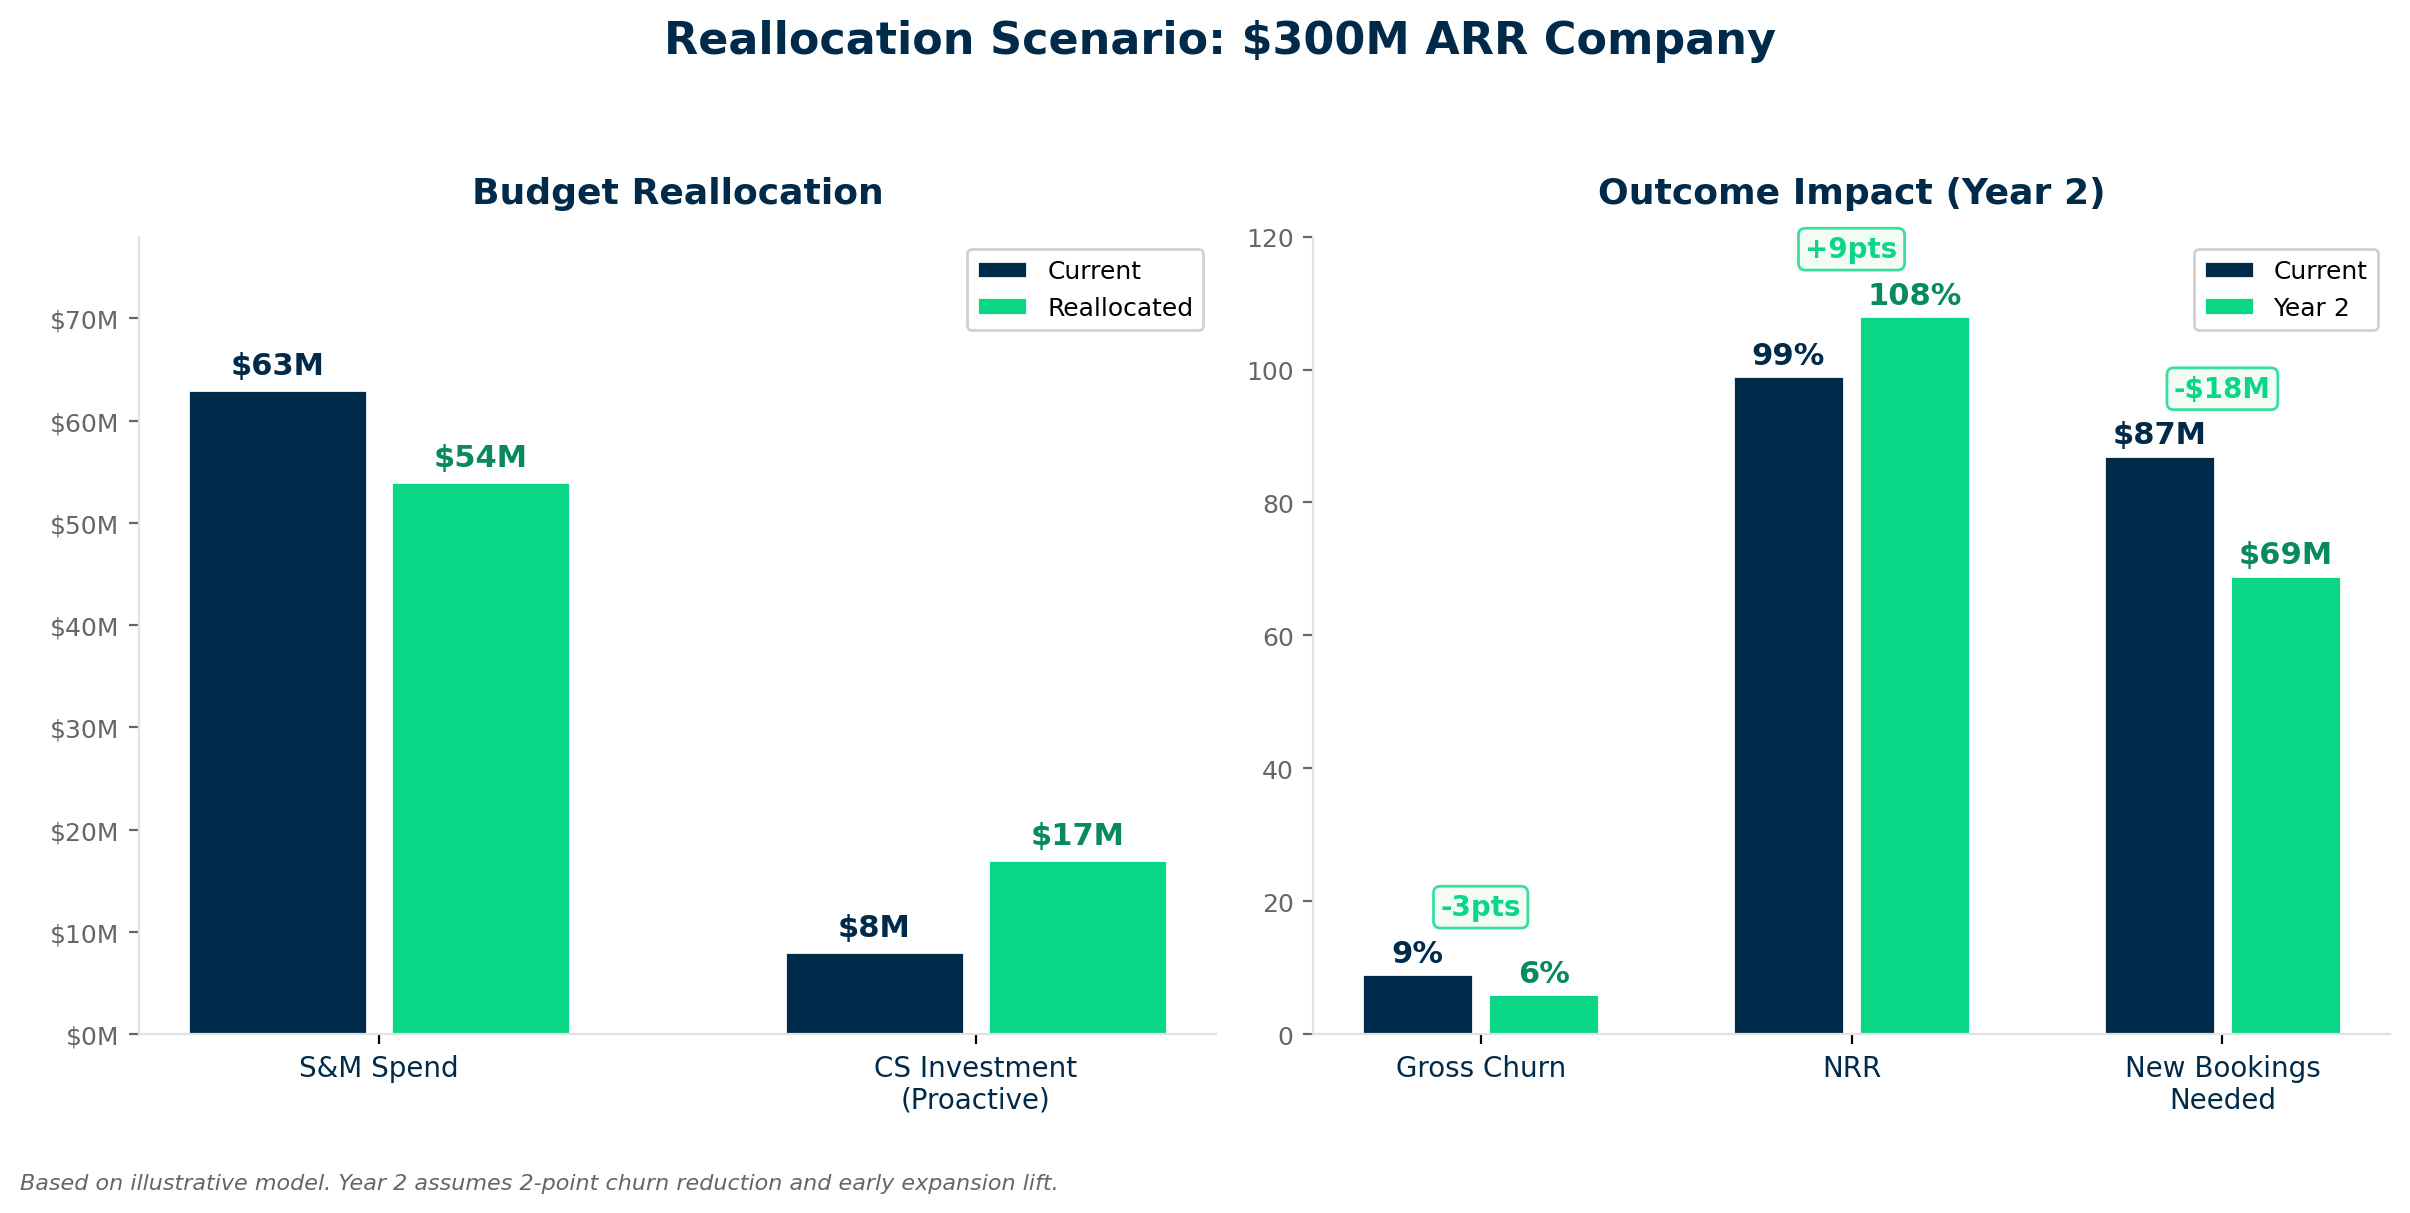
The reallocated model requires $18M less in new bookings to hit the same growth target. Dozens fewer deals your sales team needs to close, regardless of whether your average deal is $10K or $1.5M. The sales team is smaller, more focused, and closing higher-quality deals because they aren't backfilling churn.
The $9M shifted from acquisition to proactive retention and expansion generates a higher return per dollar. A dollar moved from new logo acquisition ($2.00 per dollar of ARR) to expansion ($1.00 per dollar of ARR) produces twice the revenue output. A dollar moved to retention ($0.08-$0.10 per dollar of ARR) produces 20x the revenue output. The company hits the same growth target with a more efficient GTM engine and a more durable revenue base.
By Year 2, compounding takes hold, NRR above 105% means the existing base is growing on its own. The sales team is additive to an expanding foundation instead of running to replace an eroding one. The growth target gets easier to hit, not harder.
Retention Data: The CFO's Missing Input
CFOs are trained to scrutinize cost. They review sales productivity ratios, marketing ROI, and headcount efficiency quarterly. Most CFOs don't have a framework for evaluating the return on retention investment because the data infrastructure doesn't support it.
The CFO approves a $63M sales and marketing budget because the attribution model shows pipeline velocity and a 3.6:1 LTV-to-CAC ratio on new logos. The CFO approves $24M in CS and support because "we spent this amount last year, plus a few headcount for growth." Of the $24M, $16M goes to reactive support and renewal processing. $8M funds proactive retention and expansion.
The first decision is data-driven. The second is inertia-driven. Both hit the same P&L, but one gets real analysis.
The fix starts with giving the CFO the same quality of data for retention they already have for acquisition. Quantify the Churn Tax, model the return on churn reduction, project the expansion revenue lift from CS investment, and present it in the same financial language the acquisition budget uses. We covered how to build the business case in detail.
PE Firms Are Ahead on This Realization
Private equity firms are ahead of most operating companies here. When a PE firm acquires a SaaS company and looks at the GTM budget, the imbalance is immediate. A company spending $63M to bring in new revenue while losing $27M out the back door with $8M in proactive retention investment, unchanged since the company was half its current ARR.
The smarter innovative PE operating partners are building retention investment into their first 100-day value creation plans. They're running Churn Tax diagnostics in the first 60 days post-acquisition, quantifying the revenue at risk, and reallocating capital before the first board meeting. They've figured out improving NRR from 98% to 106% adds more enterprise value at exit than incremental investment in new logo acquisition.
This is still an emerging practice, most PE firms focus their value creation plans on sales efficiency, pricing optimization, and cost reduction. Customer retention as a capital allocation decision is gaining traction, and the firms moving early are capturing outsized value.
The Reallocation Framework
Rebalancing the GTM budget is about right-sizing the investment based on where revenue comes from and the cost of generating each dollar.
Three questions to pressure-test your current allocation:
1. The installed base dependency. If 70-80% of next year's revenue comes from the installed base (and for most SaaS companies at $200M+ ARR, it does), your retention and expansion investment should reflect it. B2B SaaS companies now generate 40% of total new ARR from existing customers, and for companies above $50M ARR, the share exceeds 50% (Source: Benchmarkit 2025). The installed base is the primary growth engine.
2. Cost per dollar by revenue source. If you don't know your cost per dollar of new logo ARR versus expansion ARR versus retained ARR, you don't have the data to make an informed allocation decision. The median New CAC Ratio is $2.00. The median Expansion CAC Ratio is $1.00. The implied retention cost is $0.08-$0.10. Build these unit economics by revenue source before the next budget cycle.
3. The bookings relief model. Run the scenario: a 2-point improvement in GRR and a 3-point improvement in expansion rate. The output will show you the reduction in new logo pressure on the sales team, and the portion of your current acquisition spend going to churn replacement disguised as growth investment.
Churn Replacement Disguised as Growth
A significant portion of spending labeled "growth" is churn replacement. The sales team closes $60M in new bookings, $27M replaces churned revenue, and $33M is net-new growth. The budget, the headcount plan, and the board deck all describe $60M as the growth investment.
Separate replacement bookings from true net-new bookings, and the efficiency of the acquisition engine looks different. The case for investing in retention (reducing the replacement burden and making each acquisition dollar go further) becomes clear.
The budget assumes each dollar of sales spend drives growth. The P&L tells a different story, the companies figuring this out early allocate more efficiently, grow more durably, and trade at higher multiples at exit. The ones falling behind keep running harder on the acquisition treadmill, wondering why growth gets more expensive each year.
The Starting Point
If you're a CEO, CRO, or CFO recognizing the pattern, the starting point is straightforward: quantify your Churn Tax, model the return on retention investment, and compare the cost per dollar of revenue across your three sources (new logos, expansion, retained). The gap between current spending and the math is your reallocation opportunity.
We built the Churn Tax Diagnostic for this conversation. In 4 weeks, you get the number, the component breakdown, the maturity assessment, and an investment case with ROI projections. The output isn't a Customer Success strategy deck. It's a financial model your CFO will use in the next budget cycle.