The Math
Two numbers define how fast your installed base grows: the revenue leaking out, and the expansion revenue never coming in. Most leadership teams have quantified neither.
THE CHURN TAX
Most companies measure churn as the revenue that didn't renew. That is one piece of the cost.
The Churn Tax is the total economic impact of revenue churn: the direct revenue loss, the downstream expansion it kills, and the sales and marketing cost of replacing it. When you account for all three layers, the number runs 1.5-2.5x what most leadership teams think they're paying.
The Churn Tax Components
Most companies count only the first. The other two compound the cost.
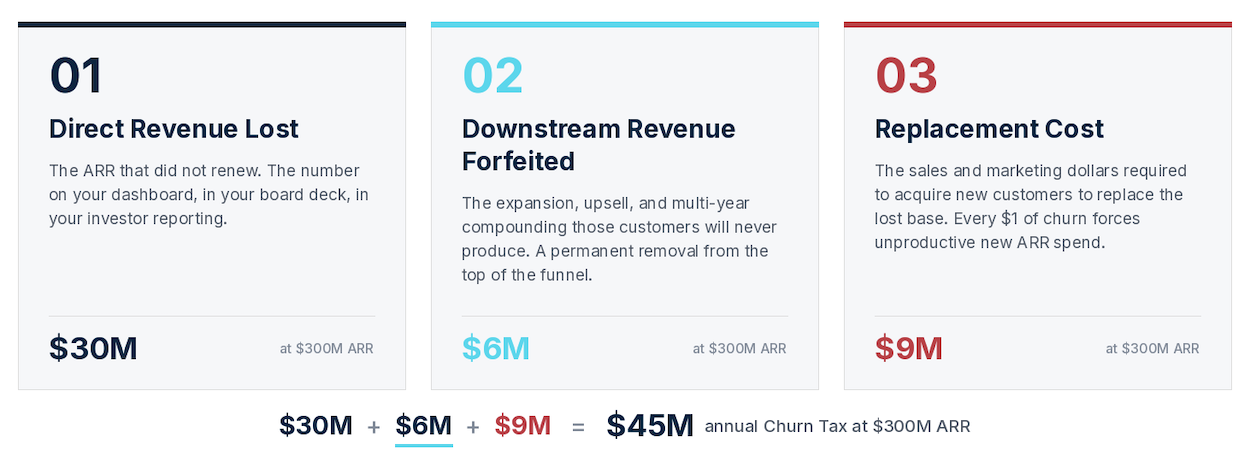
Direct revenue lost is one part of the total. The other two parts of the total hide in downstream forfeited revenue and replacement cost.
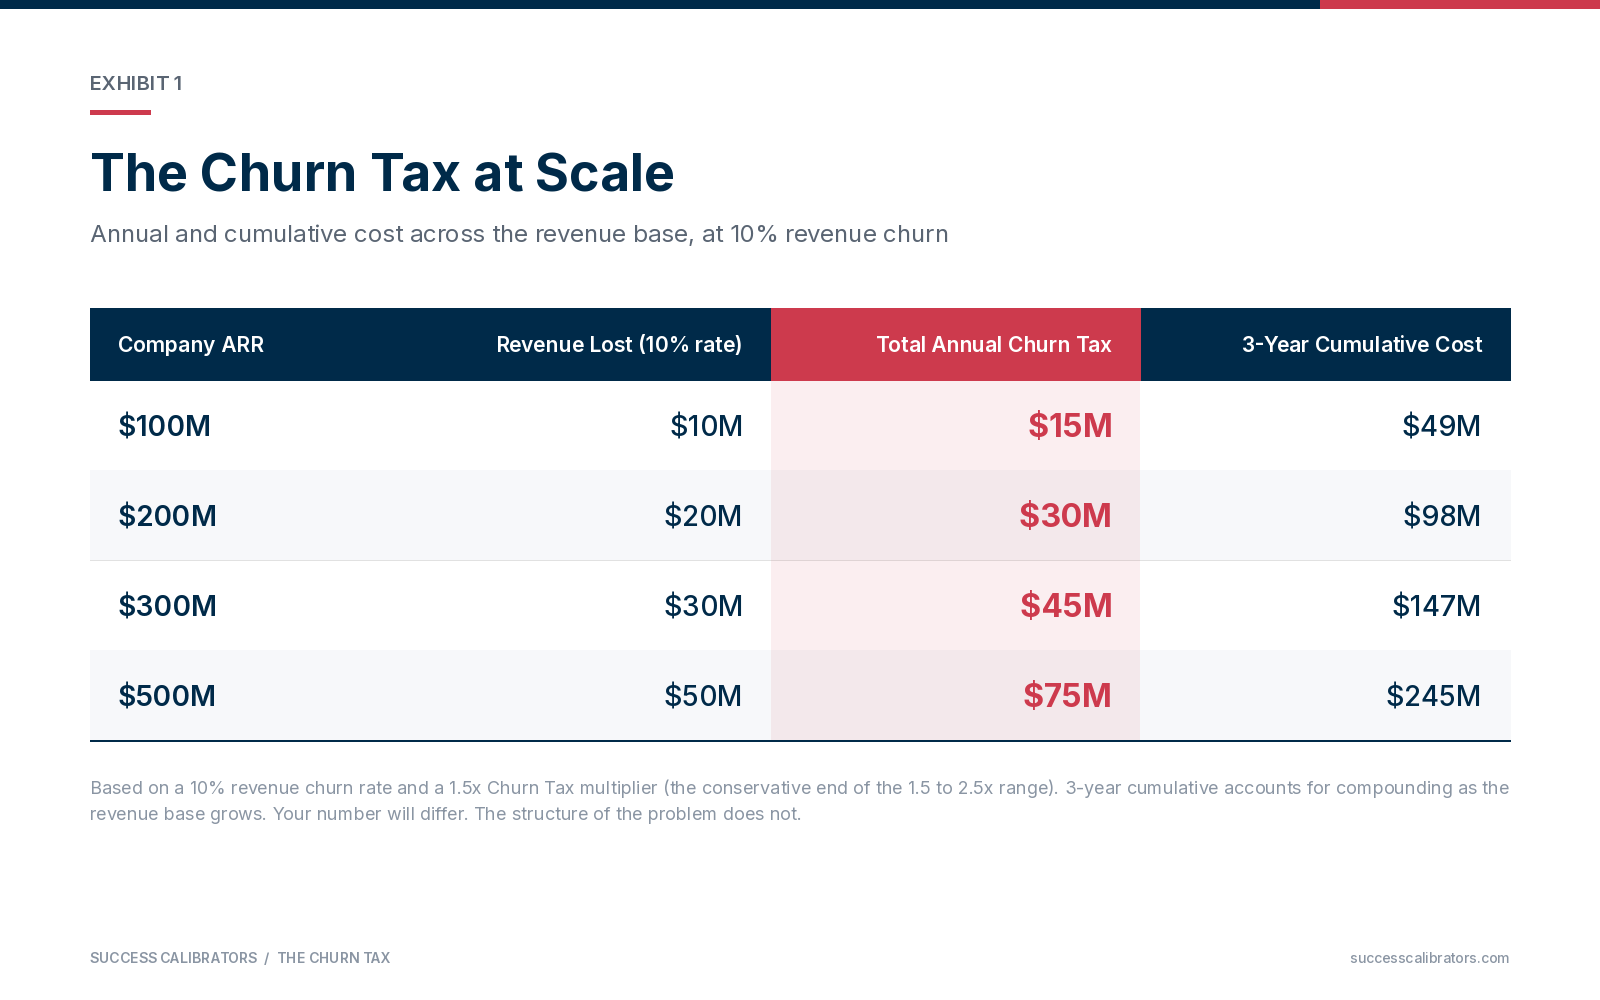
The Churn Tax at Scale
At a 10% revenue churn rate, the annual Churn Tax scales from $15M at $100M ARR to $75M at $500M ARR, with three-year cumulative exposure reaching $245M at the top of the range.
THE EXPANSION GAP
Churn measures what you lose. The Expansion Gap measures what you never book.
Top-performing SaaS companies source 40-50% of their new ARR from existing customers. Companies stuck at a 25% expansion mix are funding their entire growth plan at new-logo acquisition cost, the most expensive revenue they sell.
Expansion revenue closes faster, costs a fraction of a new logo, and compounds inside accounts where value is already proven.
The Expansion Gap at Scale
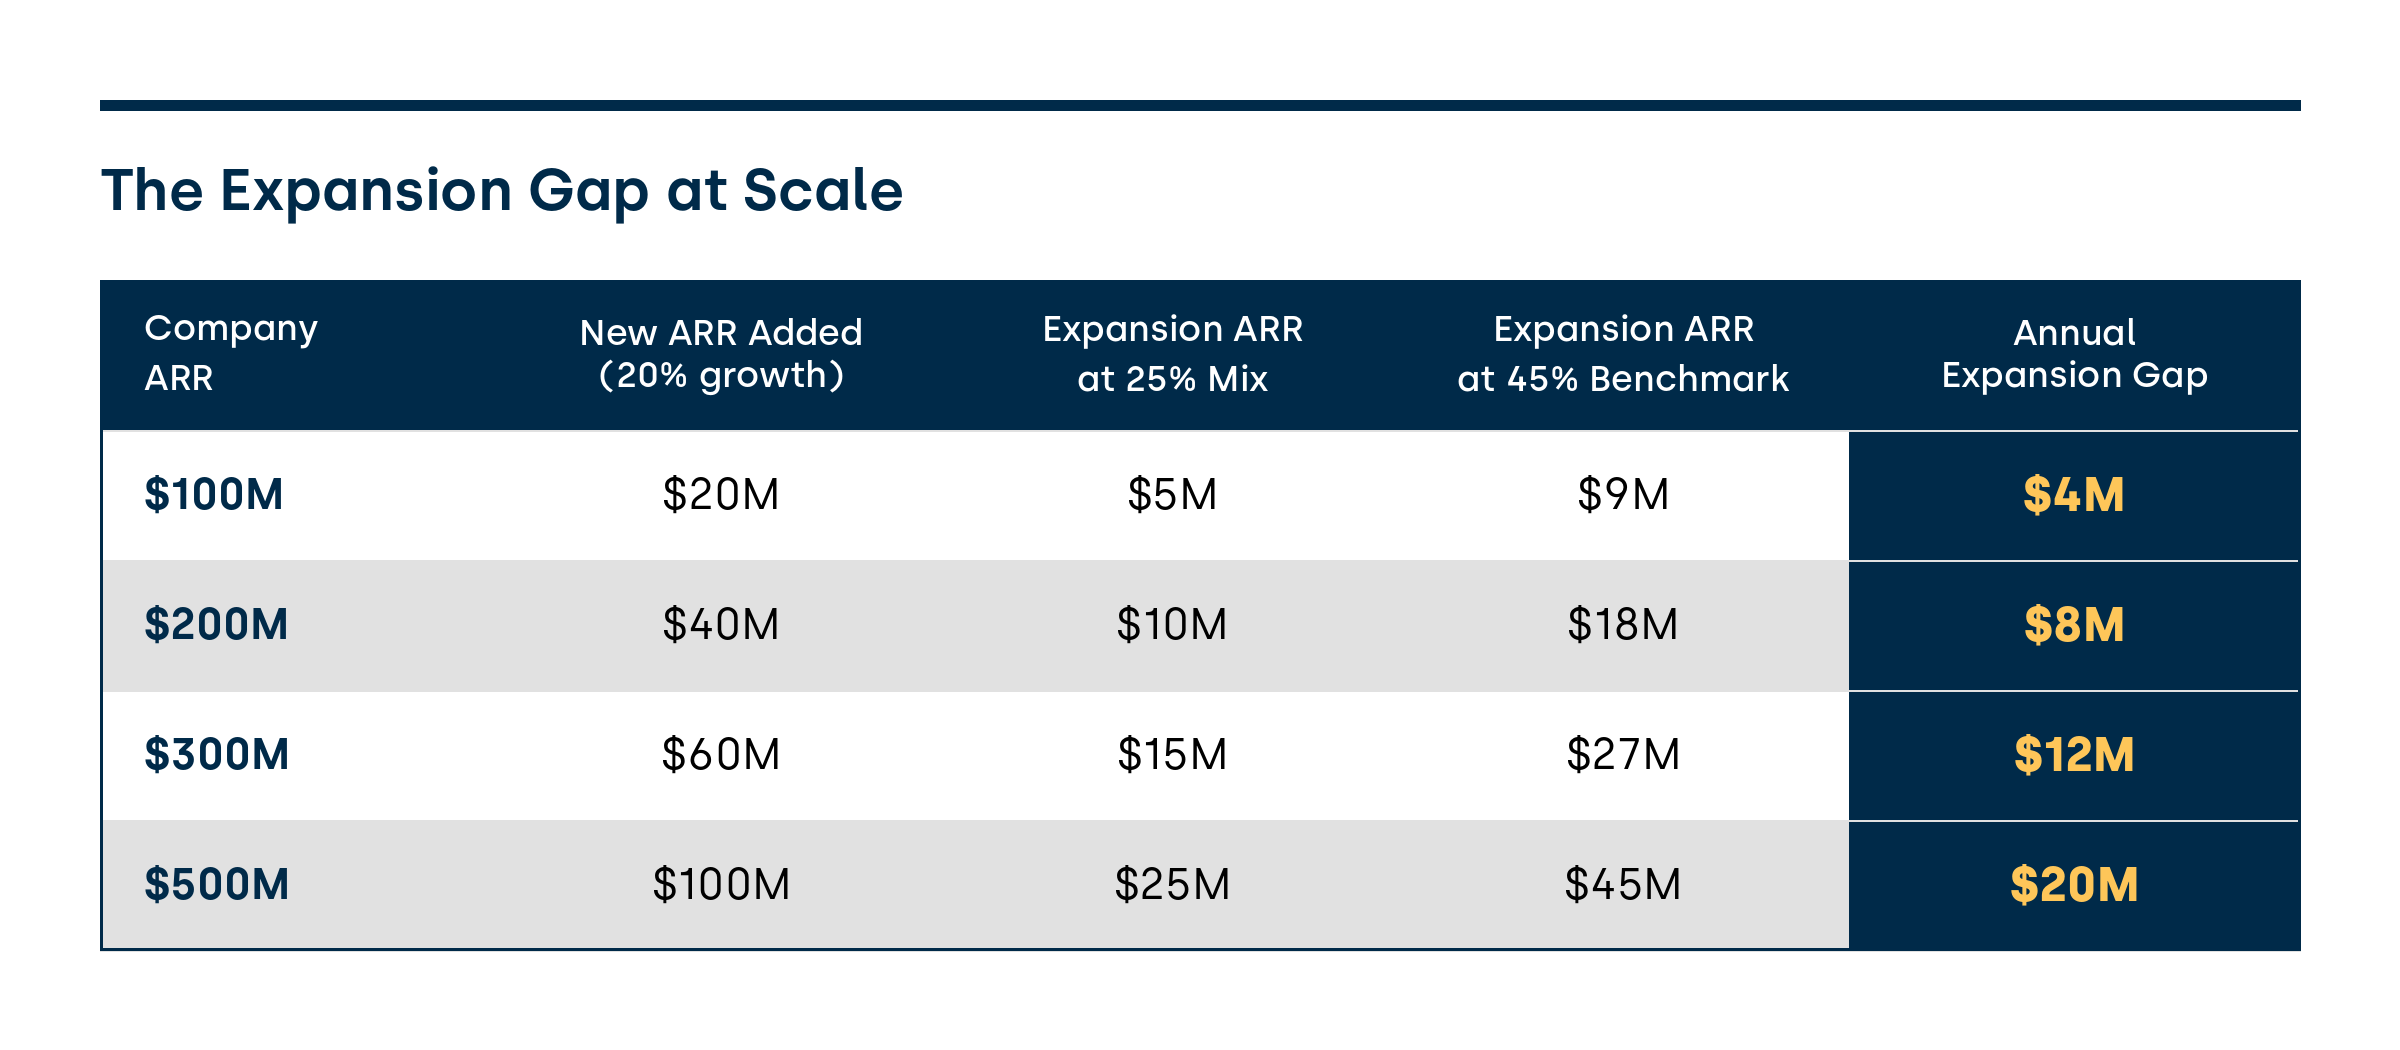
Based on 20% net new ARR growth and a 45% benchmark expansion mix. Every dollar in the gap column gets replaced by acquisition spend at 2-3x the cost, or it doesn't get replaced at all.
A low expansion mix is a symptom, and the causes sit upstream of any renewal conversation: customers sold against the wrong expectations, onboarding too slow to prove value, ROI never measured or communicated, handoffs dropping context between teams, and sales pitching accounts before they've achieved the outcomes they're already paying for. None of those problems belong to one department. Pricing and packaging matter too: if your offer creates no natural next step, no expansion motion will manufacture one.
THE RECOVERY

A mature post-sale team doesn't chase zero churn or force expansion. They reduce the leak, then build a value-led expansion motion on the retained base, so both numbers move at once. NRR captures the combined effect, which is why our success fee pays on it.
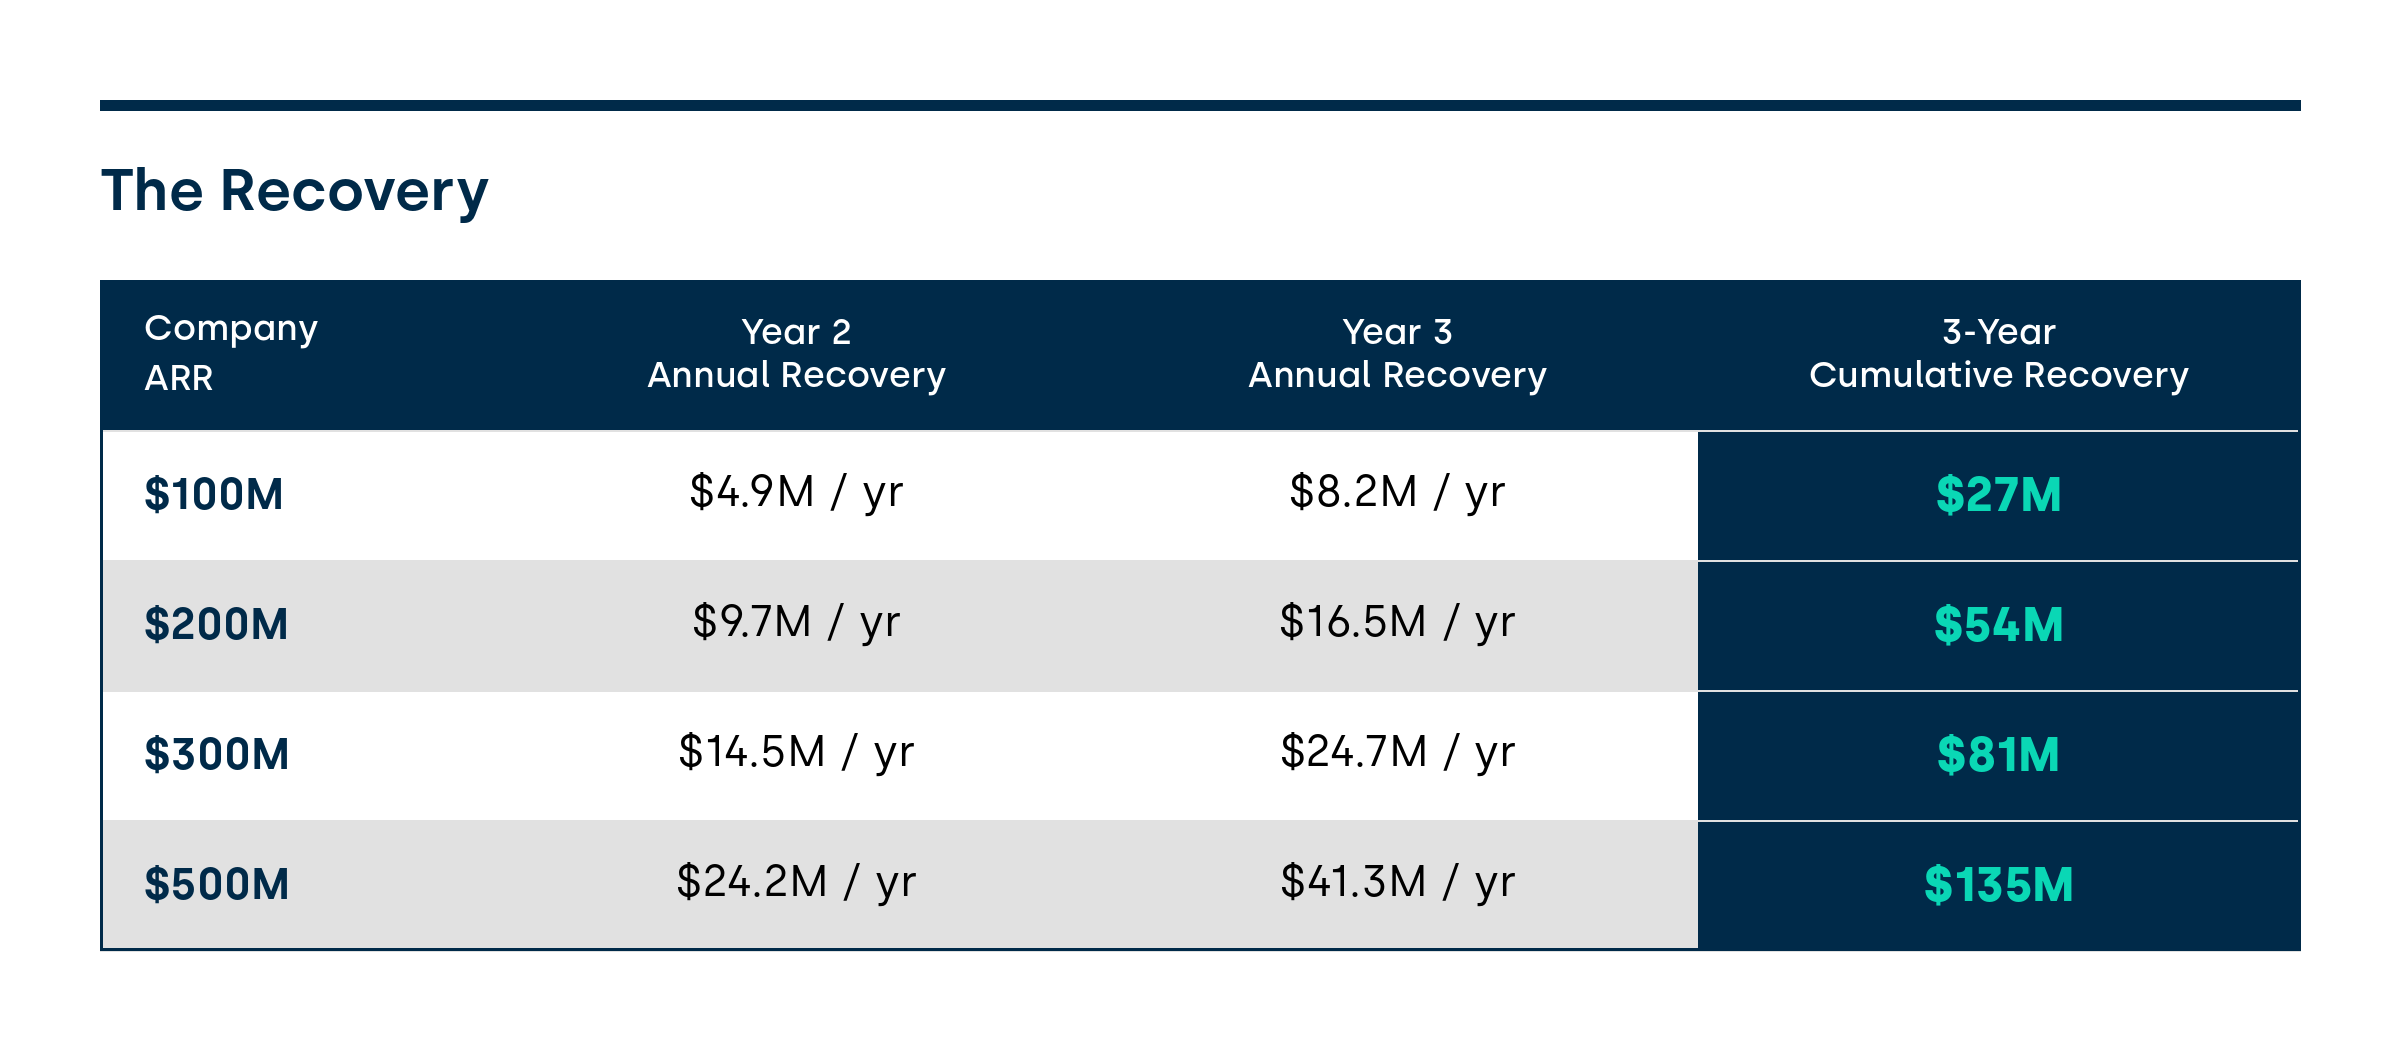
Year 2 assumes a 2 percentage point churn reduction and early expansion lift. Year 3 assumes a 3 percentage point reduction and a fully operational expansion engine. These are conservative targets based on outcomes we've delivered at scale.
The Impact on Valuation
The investment creates value two ways: higher ARR and a higher revenue multiple. Companies with NRR above 105% trade at materially higher multiples than those below 100%, because the market prices durable, efficient growth.
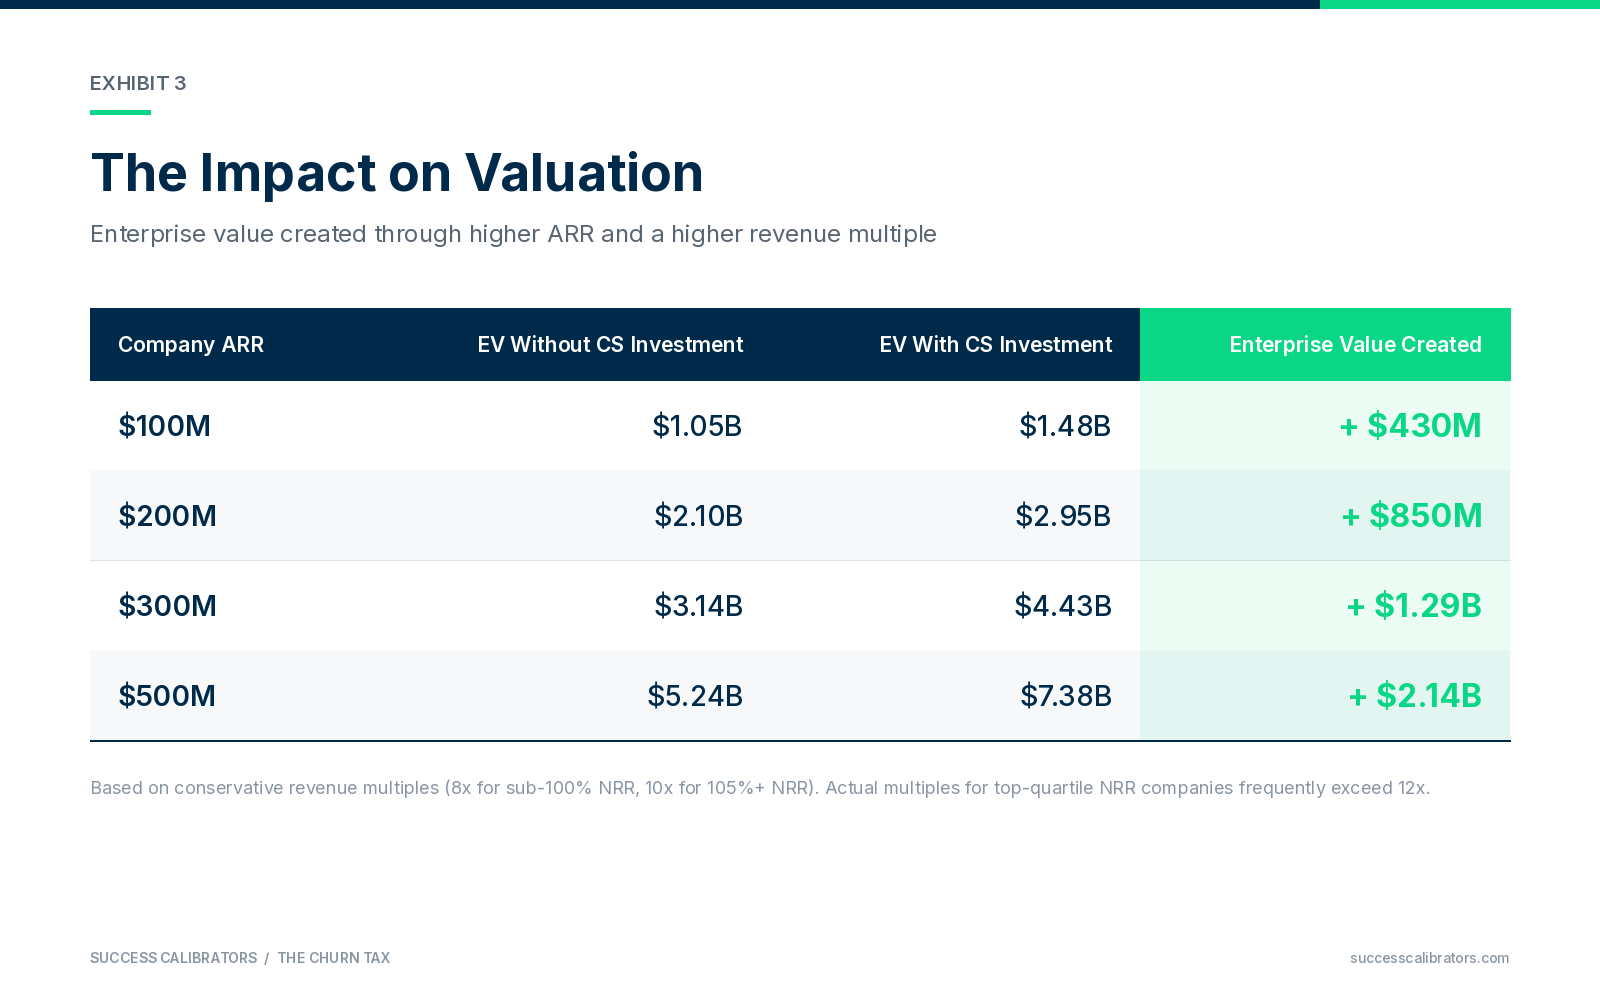
Based on conservative revenue multiples (8x for sub-100% NRR, 10x for 105%+ NRR). Actual multiples for top-quartile NRR companies frequently exceed 12x.
MODEL ASSUMPTIONS
This model runs on conservative inputs. Growth-stage B2B SaaS companies typically operate at 15-25% net ARR growth. The Churn Tax scenarios assume 10% churn, the Expansion Gap scenarios assume 20% growth and a 45% benchmark mix, and cost ratios are modeled below industry medians for high-growth companies. Your actual numbers will produce different outputs.
The structure of the problem won't change.
Want to know your two numbers?
The Revenue Success Diagnostic calculates both for your company. In 4-6 weeks, you get your Churn Tax, your Expansion Gap, the component breakdown, a maturity assessment across 7 dimensions, and an investment case with ROI projections your board will fund.
Frameworks built across $350M-$1B in CCO P&L responsibility at NYSE-listed and PE-owned SaaS companies. Track record of 95%+ GRR and 115%+ NRR at scale.