Applying the Churn Tax to Public SaaS: Two Companies, Two Different Realities
The 60-second version: We applied our Churn Tax framework to two publicly traded SaaS companies using their disclosed financials. JFrog's Churn Tax came out to 7.5% of ARR. Domo's came out to 53.8% of ARR. The same framework, applied to the same type of business model, produces radically different numbers. Here's what that reveals about retention strategy that NRR alone can't.
Why standard churn metrics hide the real cost
Every SaaS company reports a churn rate. It appears in earnings calls, investor decks, and board reports. Most leadership teams treat it as the number that captures their retention story.
It doesn't, the reported churn rate captures one layer of the true financial cost. When a customer leaves, three things happen at once:
The recurring revenue walks out the door.
The expansion revenue that customer would have generated disappears.
And the acquisition cost to replace that spend has to be funded from somewhere, usually by redirecting sales capacity that would otherwise be driving net-new growth.
We call the combined cost the Churn Tax. Across most SaaS businesses, the true financial impact runs 1.5 to 2.5 times the reported rate. A company reporting 10% churn on $300M ARR isn't facing a $30M problem. It's facing $45 to $75M in annual economic drag once all three layers are calculated.
That's the framework: Two public companies, same math, two very different outcomes.
Methodology and caveats
We built the analysis using each company's publicly available financial disclosures: 10-K filings, quarterly earnings releases, and earnings call transcripts. Revenue, net revenue retention, sales and marketing expense, and gross retention come from those disclosures. Where specific line items weren't broken out (such as Customer Success allocation within Sales & Marketing), we applied industry benchmarks such as 10% of Sales & Marketing budgets allocated to CS, from RepVue and Bridge Group, and expansion rate assumptions consistent with observed NRR.
A few important limits on what this analysis does and doesn't capture.
We didn't assess either company's Customer Success maturity, organizational structure, or execution quality. We have no visibility into what's happening inside either organization. The numbers reflect what the financials show, not what the operation looks like.
We didn't factor in strategy shifts, product roadmap changes, pricing model transformations, or execution improvements that either company may be actively pursuing. This is a snapshot of the current state and what the trajectory looks like if each company continues on the same path. A meaningful pivot, which we'll address in the Domo section, changes the forward picture significantly.
And we're only showing the Churn Tax part of the framework here, not a full Recovery Opportunity analysis. The framework can produce a directional Low-Medium-High scale of the recovery opportunity even from outside the business, based on the size of the tax and the composition of the layers. But translating that directional view into an actual recovery plan requires a diagnostic of the business itself: organizational readiness, contract terms, customer segmentation, maturity gaps, and dozens of variables that aren't visible from the outside. Quantifying the cost is the framework's job. Mapping the path forward is the diagnostic's job.
JFrog: a reference point, not a target
Fiscal 2025 snapshot (ended December 31, 2025):
Revenue: $531.8M, up 24% year-over-year
Net Dollar Retention: 119% (trailing four quarters)
Customers with ARR >$100K: 1,168
Customers with ARR >$1M: 74
Fortune 100 penetration: approximately 83%
Cloud revenue: 48% of total, up 42% YoY
Enterprise+ subscriptions: 57% of revenue
Revenue churn rate: 3% (implied from 97% GRR)
Churn Tax analysis:
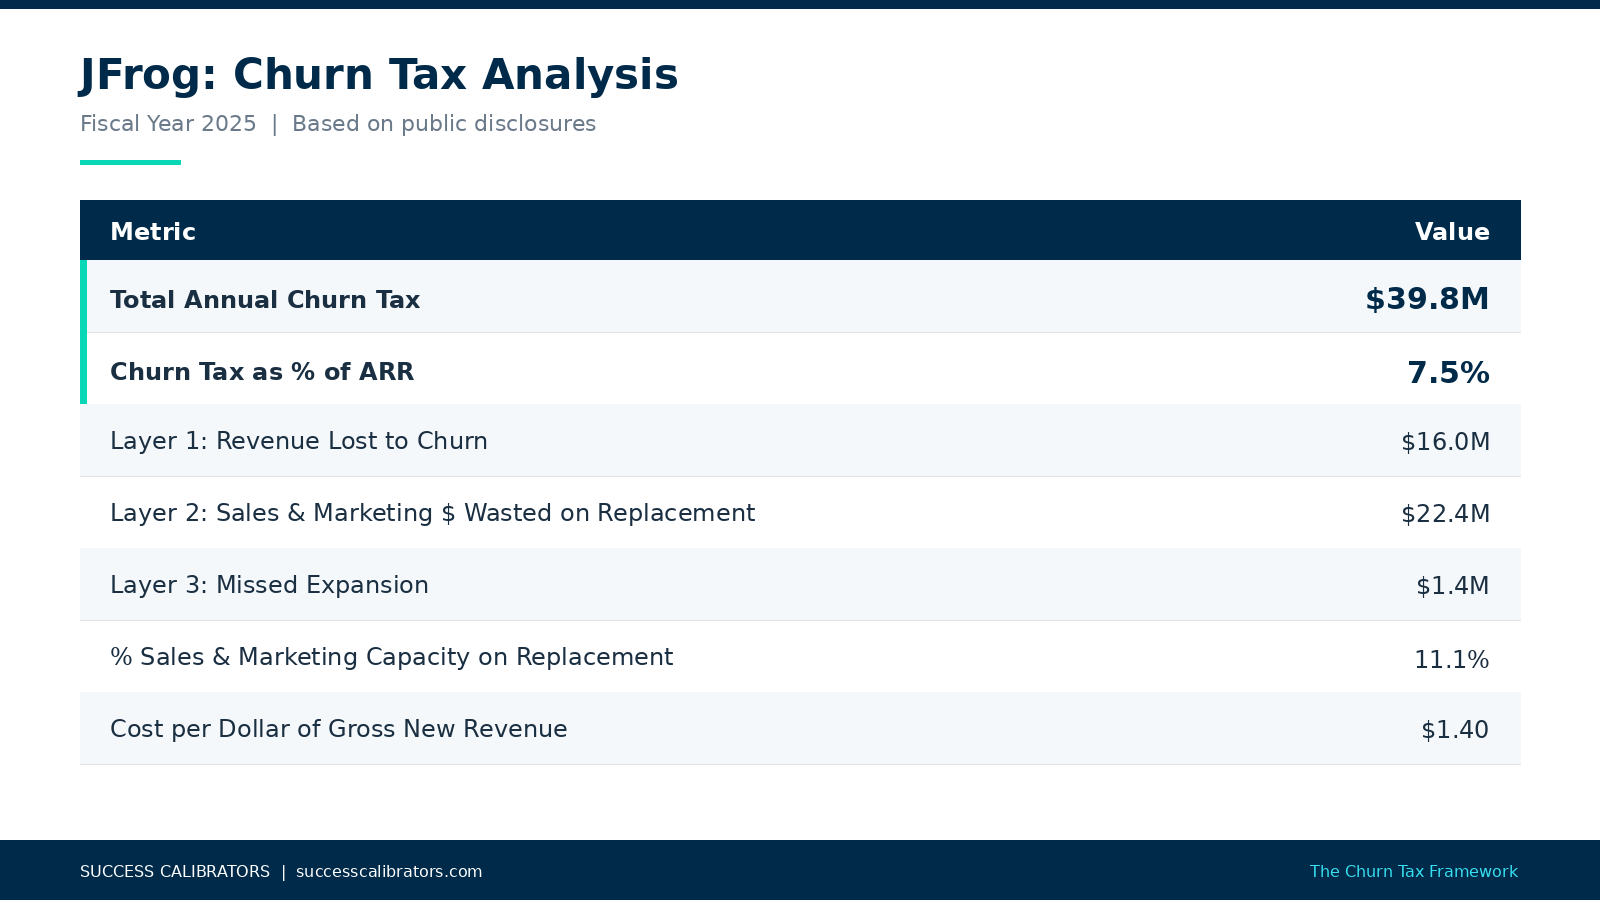
JFrog disclosed gross retention of 97% in their fiscal 2025 annual earnings call, which implies a 3% revenue churn rate. That number is exceptional by any B2B SaaS benchmark, and it's worth being clear about what drives it. JFrog serves approximately 6,600 organizations with a platform that 83% of the Fortune 100 uses. Their customer base skews heavily enterprise, with 1,168 accounts above $100K ARR and 74 above $1M. Enterprise+ subscriptions, the end-to-end platform offering, represent 57% of total revenue. Multi-year contracts at enterprise scale produce structurally different churn outcomes than annual SMB subscriptions.
Which is to say: 3% isn't the target most companies should be chasing. It's a reference point that reflects a specific business model, a specific customer profile, and a contract structure that the majority of SaaS businesses don't operate under. The useful insight isn't the absolute number. It's what the Churn Tax looks like when retention is functioning as designed.
At $39.8M in annual Churn Tax on $531.8M ARR, 11.1% of sales capacity is being used to replace churned revenue. That's $22.4M of the $201.5M total cost of revenue acquisition, going to refill what was lost rather than to drive net-new growth. Even at best-in-class retention, the cost still exists. It just runs at a level that doesn't materially constrain the growth trajectory.
Domo: the cost of the path before the pivot
Fiscal 2026 snapshot (ended January 31, 2026):
Revenue: $318.9M (flat for three consecutive years: $319M, $317M, $318.9M)
ARR Net Retention: 96% (up from 89% prior year, sixth consecutive quarter of sequential improvement)
Gross Retention: over 88% (highest level in 12 quarters)
84% of ARR now on consumption pricing (vs. seat-based)
Consumption cohort NRR: 111%
Revenue churn rate (implied from gross retention): ~12%
Full year billings: $318.7M, up 3% (first full-year billings growth since fiscal 2023)
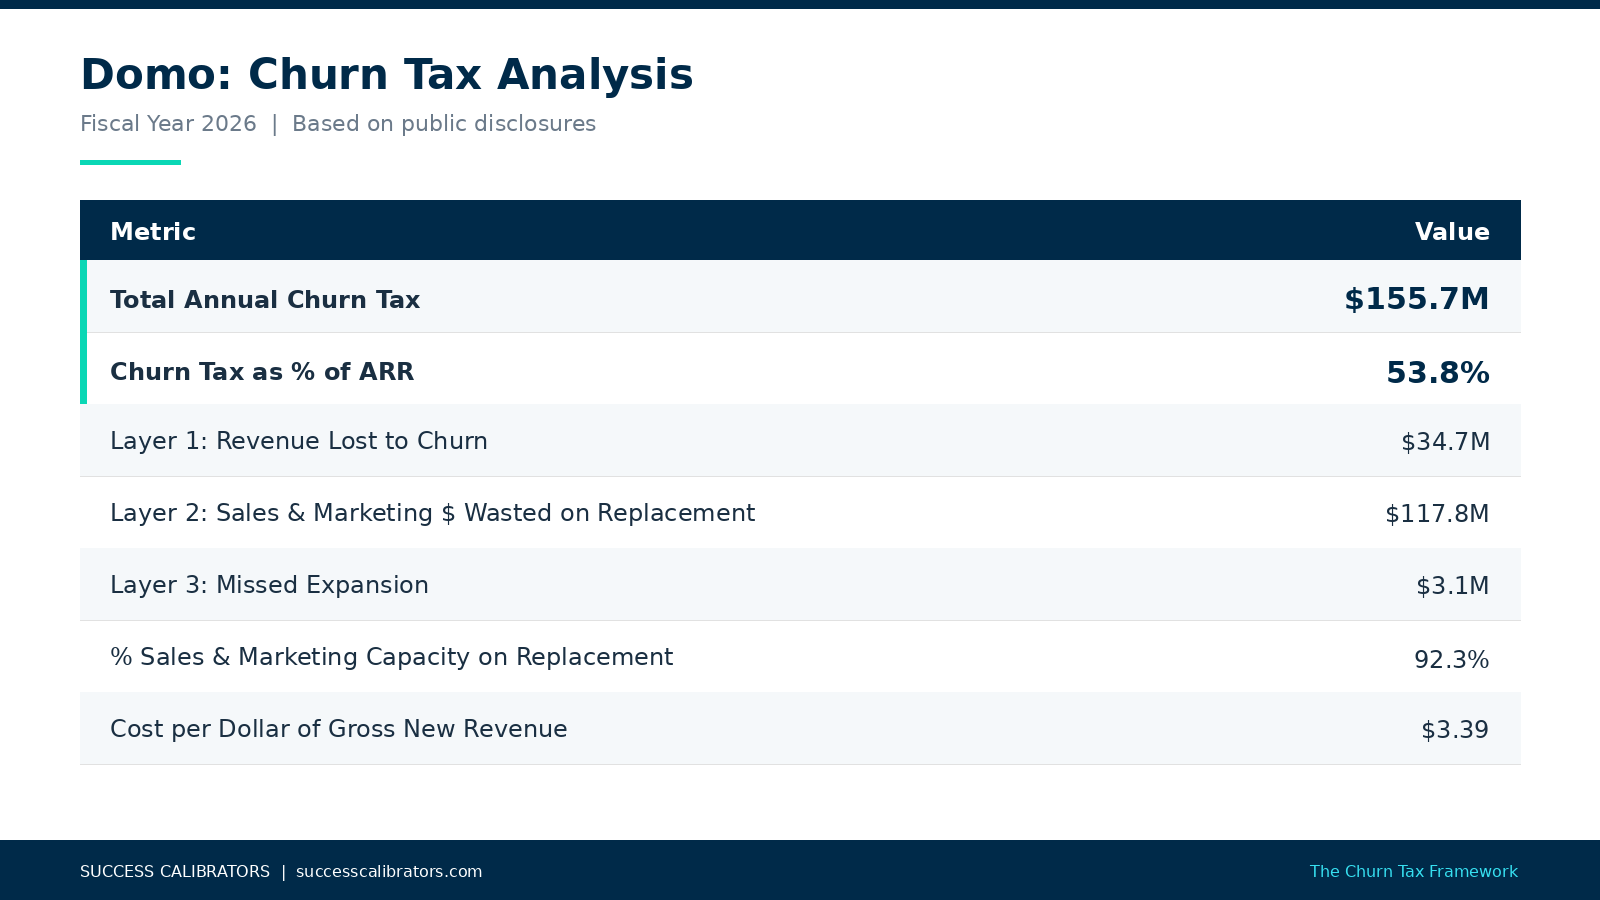
Churn Tax analysis:
This example requires careful framing: Domo is in the middle of a significant business model transformation. Over the past year, they've moved from seat-based pricing to consumption pricing, with 84% of ARR now on the new model. Gross retention is the highest it's been in three years. Net retention has improved by more than 4 percentage points year-over-year, with six consecutive quarters of sequential improvement. The cohort of customers who started on consumption contracts is delivering 111% NRR.
The Churn Tax numbers we calculated reflect Domo's historic state, not the turning point they appear to be in. If the transformation continues to produce the retention improvements management has been reporting, the forward trajectory looks different than what the snapshot captures.
That context matters, and it also makes the opportunity the transformation is targeting visible in a way the reported metrics don't. If Domo's business weren't pivoting, the Churn Tax we've calculated would represent a massive operational and financial challenge. 92.3% of sales and marketing capacity going to replace churned revenue means the acquisition engine is running at full effort just to offset attrition, with almost nothing left over for net-new growth. Net-new revenue coming in at negative $12.2M means the business would be shrinking despite an active go-to-market motion.
The framework makes this stark. It also validates why the pivot was necessary. The numbers quantify the financial cost of the path Domo was on before the consumption model shift, and they clarify what the improving retention metrics are actually worth when the compounding effects flow through to sales efficiency.
The contrast NRR doesn't show
Here's what the two companies look like side by side:
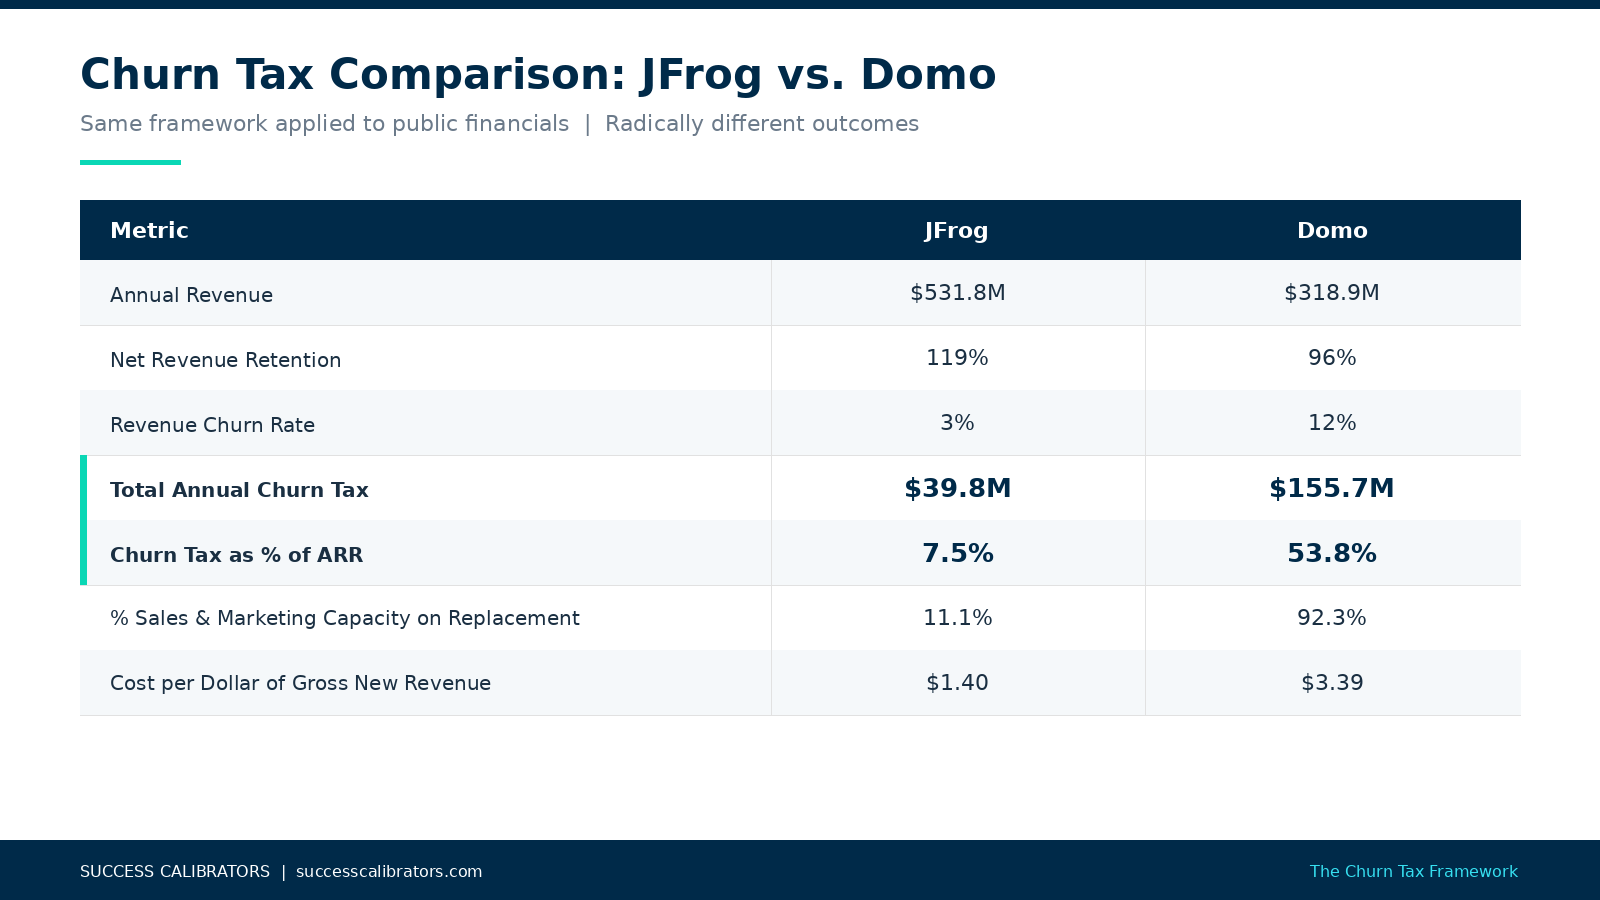
The NRR gap between the two companies is 23 points, 119% versus 96%. That sounds like a significant but manageable difference.
The Churn Tax tells a different story. As a percentage of ARR, Domo's is 7x the size of JFrog's. Domo is spending $3.39 to generate every dollar of new revenue versus JFrog's $1.40. Nearly the entire sales and marketing budget at Domo is functionally going to offset churn rather than driving expansion.
This is the gap the Churn Tax makes visible: two companies reporting NRR numbers that look within the same range produce wildly different financial pictures once all three layers of the cost are surfaced, NRR captures the net result, the Churn Tax captures the gross work required to produce it.
What this means for every SaaS leader
The point of this analysis isn't to grade either company. JFrog runs a retention engine that supports 119% NRR at enterprise scale, driven by platform expansion and multi-year contracts at Fortune 100 scale. Domo is executing a transformation that, based on the metrics they're reporting, is beginning to reverse a historic retention challenge.
The point is that the reported churn rate and the NRR number don't surface the full financial picture of a company's retention posture. Until you calculate the Churn Tax, the compounding cost of lost revenue, forfeited expansion, and wasted sales capacity stays invisible on the P&L. Leaders making decisions about Customer Success investment, retention strategy, or go-to-market sequencing with only the standard metrics are working with a fraction of the picture.
The question every SaaS leader should ask is what their own number is. Not because 7.5% or 53.8% is the right benchmark, but because calculating the Churn Tax forces the conversation about where the cost is coming from, which layer is the biggest driver, and what would need to change to reduce it.
Getting to the number is only the beginning, the harder work is understanding why the number is what it is, which maturity gaps are driving it, and what a realistic recovery path looks like based on the business model, contract terms, and organizational readiness. That's the conversation that turns the Churn Tax from a metric into a strategy.
If you want to know what your organization's Churn Tax actually is, and what the structural drivers look like once you can see them, that's the work we do.
Contact us to discuss a Revenue Diagnostic for your organization →
This analysis is based on publicly available financial disclosures from JFrog Ltd. (NASDAQ: FROG) fiscal year 2025 and Domo, Inc. (NASDAQ: DOMO) fiscal year 2026. It does not reflect any internal information about either company's operations, strategy, or future outlook. Sources: JFrog 10-K and Q4 2025 earnings release; Domo 10-K and Q4 FY2026 earnings call transcript.