Existing Revenue Under Pressure: Why the Customer Success Recovery Window Just Compressed

Existing revenue inside SaaS came under a different kind of pressure this month. Two announcements reset the operating assumptions most customer success teams work under.
ClickUp restructured its workforce around a 100x operating model, with 22% of staff cut and salary bands extended to $1 million for roles producing the largest impact.
Intuit told investors that 50 million transactions per week now flow through AI, with task-completion-based pricing rolling out in August. The pricing model retaining revenue is changing, the operating model protecting revenue needs to be rebuilt.
The financial implication for leadership teams running SaaS companies above $200 million in ARR is direct. Renewals ran on an annual cycle, even multi-year. Customer success operating model changes took 12 to 18 months to influence renewal outcomes, because customers form their renewal posture well before the contract end date as value perception accumulates. Both conditions change under metered revenue and an AI-augmented org structure. The recovery window compresses meaningfully, the compression is positive for teams funding the right operating model rebuild early, but it carries a real cost for teams waiting.
ClickUp and Intuit, read through a revenue lens
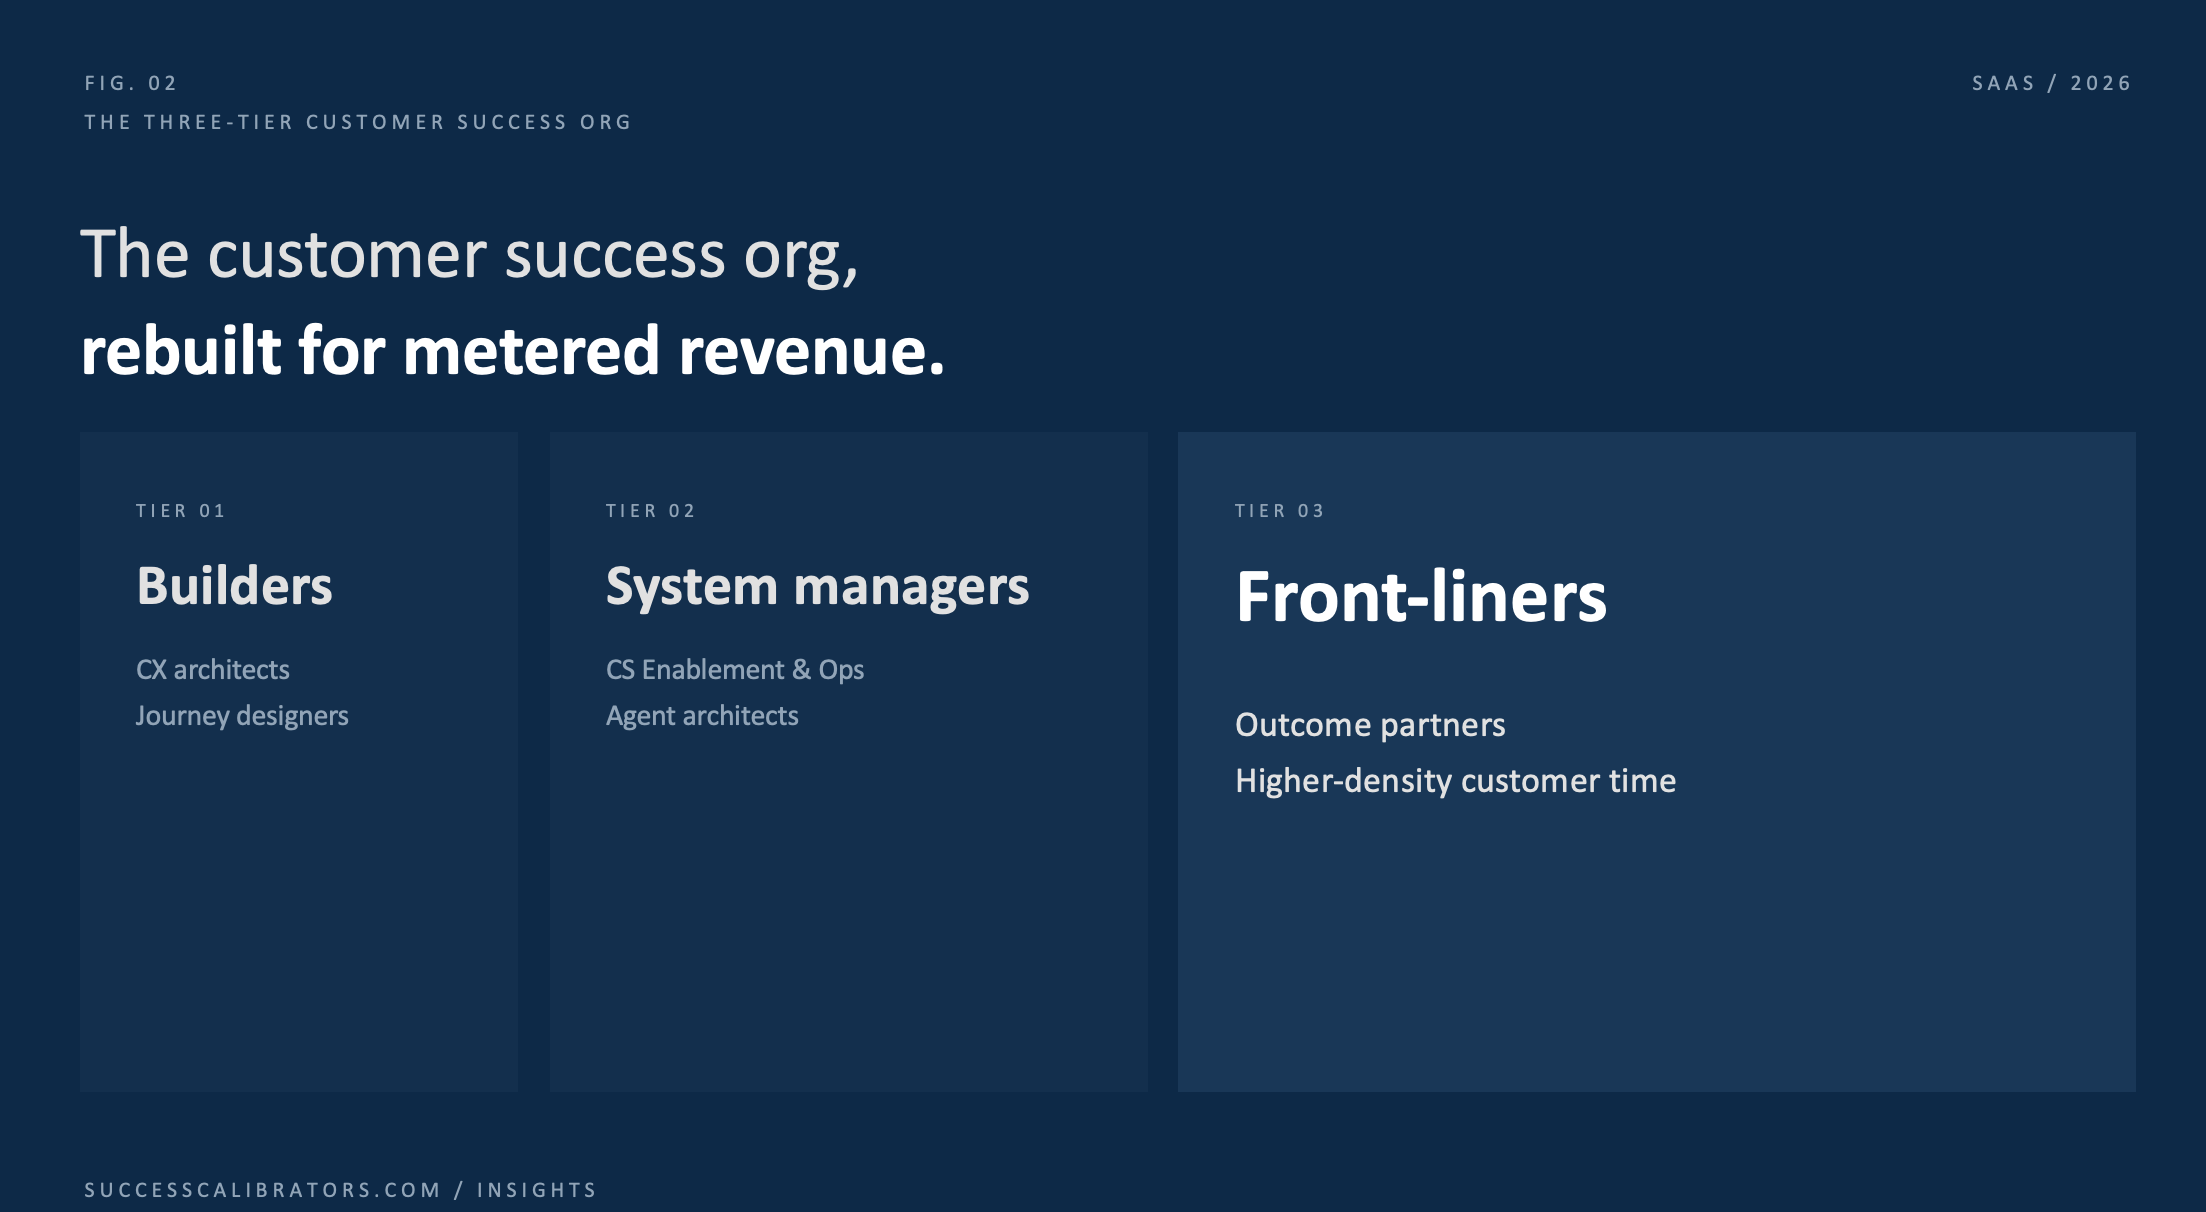
ClickUp's reorganization around three personas (Builders, System Managers, and Front-liners) collapses the layer of customer success work spent on internal coordination, reporting, and escalation orchestration. The company now runs 3,000 internal AI agents, a ratio of about three agents to every remaining employee. Front-liners exist for customer time, agents handle the work between meetings.
Intuit's August launch shifts the customer relationship from access pricing to outcome pricing. Customers pay for completed tasks and Expert+AI services delivered, with the CEO framing the new structure as moving from product feature to workflow engine. The contract layer becomes consumption signal at the workflow level.
Read these two together and the implication for existing revenue lands sharply. Both the operating model and the pricing model shifted at the same time, in opposite directions of the old assumptions.
The first pressure: the loss window collapses
Under fixed-fee renewals, revenue leakage surfaces as a contract event. The customer pays through the term and the loss arrives at renewal. Customer success teams have close to a full year to identify risk, behavior change, intervene, and recover the relationship before the revenue impact reaches the P&L.
Under consumption pricing, the risk window collapses:
An unused workflow becomes unrecognized revenue inside the same week it goes unused.
A customer slowing task volume in March no longer triggers a renewal conversation in September. The revenue impact lands in March, inside the same monthly close.
The Churn Tax multiplier holds at 1.5 to 2.5x. We've held that range across our published analyses, including the Churn Tax framework, but the recovery interval is what changes. The three layers of the tax (lost recurring revenue, forfeited expansion, and replacement customer acquisition cost) compound on a faster cycle when revenue is metered weekly rather than billed at a fixed rate.
For a $300 million ARR business at 8% reported churn, the effective Churn Tax sits at roughly 20% of revenue, or $60 million a year. This is the diagnostic baseline we published in the Revenue Recovery Blueprint article. Under metered revenue, that $60 million no longer surfaces as an annual event. It surfaces as a continuous leakage signal the operating model has to read and respond to in close to real time.
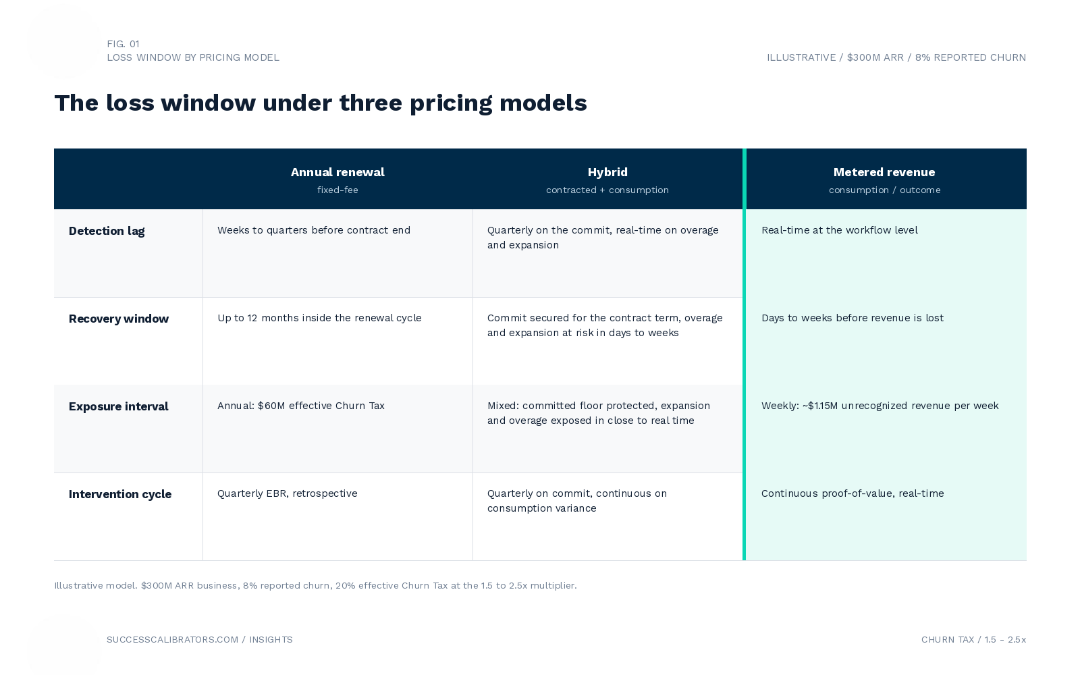
Illustrative model. $300M ARR business, 8% reported churn, 20% effective Churn Tax at the 1.5 to 2.5x multiplier.
The second pressure: the Customer Success recovery window compresses
Customer success retention improvements usually take 3 to 6 quarters to compound, with product-led businesses on the faster end and enterprise platforms on the slower end. This timeline is standing guidance.
The new operating reality changes the math meaningfully. Two factors drive the compression:
The first is observability. Under metered revenue, the leading indicators of retention move from a delayed quarterly signal (renewal forecast, NRR roll-up) to a continuous one (task volume, workflow usage, completed-action density). Customer success teams see the early indicator of loss faster. The faster signal shortens the cycle between intervention and measurable lift.
The second is operating leverage. The ClickUp three-tier model removes the layer of customer success work absorbed by internal coordination, reporting, and escalation orchestration. A system manager and an agent stack handle that load.
The front-liner spends a higher share of capacity on customer-facing outcome conversations. The intervention surface area expands inside the same headcount, which compounds faster recovery and growth on the same investment dollar.
The compression is positive for leadership teams funding the operating model rebuild early. The same work generates measurable lift in a shorter window than the old model permitted. The compression is a problem for teams waiting, the cost of delay climbs because the loss window underneath them also shortens. Existing revenue will leak faster than the old quarterly cadence revealed if you’ve moved to outcomes-based or consumption-based pricing.
The third pressure: the CS operating model wasn't built for either change
The customer success operating model most SaaS companies run today was designed around two assumptions no longer holding under these new conditions.
The first is the annual renewal cycle. Forecasting, comp plans, EBR rhythms, and capacity models align to that cycle.
The second is a generalist customer success manager role running standardized playbooks across a book of business.
Both worked when revenue was a contract event and the operating model had quarters to operate inside each renewal window.
Under metered revenue and an AI-augmented operating layer, the generalist customer success manager role loses value fast. But two roles grow in value: the front-liner runs real outcome conversations with customers at higher velocity. The system manager architects the agents and automations handling the work between meetings and behind the scenes.
Three changes to the operating model carry the largest share of the response.
The first change is renewal motion rebuild, annual renewals become a continuous proof-of-value motion with weekly leading indicators tied to consumption signals. The Executive Business Review cadence still exists at the executive level, an always-on signal layer drives intervention in real time underneath it.
The second change is forecasting at the workflow level. Pipeline and revenue forecasts run at the workflow density and task-completion level rather than at the contract level. The principle holds across operating structures: the leadership team reads existing revenue as a continuous signal rather than as a quarterly forecast exercise, with the ownership distribution shaped by each company's existing functional architecture. The data layer is shared. The interpretation is centralized.
The third change is operating-model investment that funds the agent architecture and the system manager layer alongside the front-liner headcount. The hiring profile we see at most $200 million-plus SaaS companies is heavy on generalist customer success managers and light on the technical agent-architecture roles. The ratio inverts under the new model, we cover it in our Blueprint phase: year One investment funds human-and-agent ratios at the segment-tier level instead of a flat customer-to-CSM ratio across the book.
The value creation plan math
For PE operating partners, the transmission runs through net revenue retention to enterprise value. The McKinsey Net Revenue Retention Advantage study tracked 100 B2B SaaS companies across a five-year window. Top-quartile NRR traded at a 24x revenue multiple. Bottom-quartile traded at 5x. The Bessemer Cloud Index segmentation showed the 110% and 120% NRR thresholds trigger step changes in the multiple rather than a gradual climb. We laid out the transmission in the 108% is the new NRR median article.
The exposure for a $300 million ARR portfolio company sitting at 108% NRR with a 7-point lift to 115% available competes head-to-head with the largest levers in the value creation plan, including price increases, cost rationalization, and bolt-on integrations, on a per dollar of incremental investment basis. The compressed recovery window changes the math. The same 7-point lift surfaces in fewer quarters than the old timeline modeled, which raises the priority of the customer success investment relative to the visible 100-day levers.
Two structural features push back against the priority. The first is the 100-day clock, PE post-close cadence runs fast, visible action: pricing actions, cost rationalization, executive hires, bolt-on integrations. When the portfolio company moves to consumption or outcome pricing inside that 100-day window, the customer success operating model rebuild has to run on the same critical path. Our Revenue Recovery diagnostic and Blueprint together run 8 to 12 weeks. Running them concurrently with the pricing change puts the operating model in place before the loss window opens, instead of after, when existing revenue is already leaking against the new metering structure.
The second is the competency set. PE operating partners carry deep playbooks on sales, finance, and product. The customer success operating model under metered revenue requires a different specialization rooted in customer intelligence, revenue intelligence, and engagement strategy applied at workflow density. The default routing delegates the rebuild to the in-house customer success leader, who carries the work in a silo. The work requires cross-functional authority and leadership-team buy-in on customer success as a company-wide function.
Actions for CEOs, CROs, and PE operating partners
Three actions match the compressed window:
The first action is a full Phase 1 diagnostic: reported churn no longer reveals what the operating model has to fix when revenue is metered weekly, because the leakage signal sits at the workflow level rather than at the contract level. Phase 1 rates customer success and AI maturity against our extensive model, identifies the root causes of churn and the gaps in the current customer success motion, and produces the Recovery Thesis the Blueprint operationalizes. Churn Tax exposure quantification sits inside the diagnostic and supports the business case for the recovery investment.
The second action is the Blueprint phase: the financial, operating, and execution layers convert the diagnostic into a 12-month recovery plan. The plan covers the Year One investment envelope, Total Addressable Revenue sizing with driver-and-lever mapping, capacity modeling at human-and-agent ratios, and a 12-month execution scorecard with leading and lagging indicators. We detailed the three-layer Blueprint structure in last week's article.
The third action is sequencing the right Year One moves. The mapping of drivers and levers of retention and growth, value pathways and the development of a sophisticated engagement segmentation carry the largest share of Year One lift, allowing to develop an effective engagement strategy for revenue acceleration. It provides a new operating model foundation that compounds faster because leading indicators surface inside weeks rather than quarters.
The compressed window is the opportunity
The shift hitting SaaS this month puts existing revenue under pressure and at the same time gives leadership teams a faster path to recovery if they fund the right work early. The 12-to-18-month delay between operating model changes and their effect on renewal outcomes compressed meaningfully. Teams moving now see measurable lift in a shorter window than the old model permitted. Teams waiting absorb a faster loss against a shorter renewal cycle and a steeper Churn Tax compounding.
The Revenue Recovery program is structured for this moment.
Phase 1 quantifies the exposure and surfaces the root causes and priorities the operating model has to address.
Phase 2 converts the diagnostic into the operating model the recovery requires.
Phase 3 calibrates and measures implementation: The 12-month execution carries 75% of fees at risk against net revenue retention improvement targets, because the commercial structure aligns Success Calibrators' economics to the same recovery outcome the value creation plan tracks.