
Inside the Revenue Recovery Blueprint. The Operating Layer Most Value Creation Plans Skip

Most value creation plans we’ve seen carry a retention number on slide 14, an EBITDA target on slide 22, and nothing in between. The retention number sits as an aspiration, the EBITDA target sits as a board ask, and the operating layer connecting the two doesn't exist on paper.
Year One value leaks through this gap. The plan models 110% net revenue retention by the end of the hold, the operating model still runs closer to 100%, and by the time the gap surfaces on a quarterly review, the 3 to 6 quarter lag inherent to customer success retention work has already burned a portion of the hold period.
Reported churn at 8% carries an effective Churn Tax of roughly 20% of revenue once you aggregate the three layers, lost recurring revenue, forfeited expansion, and replacement customer acquisition cost. The multiplier runs 1.5 to 2.5x. For a $300M ARR business, the exposure sits at $60M a year. This is the diagnostic baseline most boards should start asking for, and Success Calibrators published the framework.
The diagnostic answers what the problem is and the real financial impact. It surfaces opportunities and priorities. The Blueprint answers what we build to recover it.
The retention-to-multiple transmission
Net revenue retention moves enterprise value through the revenue multiple, and the multiple doesn't scale linearly. McKinsey's Net Revenue Retention Advantage study tracked 100 B2B SaaS companies across a five-year window. Top-quartile NRR traded at a 24x revenue multiple. Bottom-quartile traded at 5x. The 19x spread sits on retention performance, with nothing else in the cap table explaining the variance.

The Bessemer Cloud Index segmentation puts the curve in sharper relief.
Moving from 108% to 115% NRR carries more multiple expansion than the linear math suggests because the bracket boundaries compound. Crossing 110% and 120% triggers a step change in the multiple, not a gradual climb. A PE Operating Partner running the math on a $300M ARR business at 108% NRR sees a 7-point NRR lift compete head-to-head with the largest levers in the value creation plan, including price increases, cost rationalization, and bolt-on acquisitions, on a per dollar of incremental investment basis.
The execution problem is the lag: NRR work compounds across 3 to 6 quarters before the headline number moves, with product-led businesses on the faster end and enterprise platforms on the slower end. CEOs firing the customer success leader in Q1 because the dashboard hasn't moved kill the recovery before it has time to surface.
The Blueprint, three layers
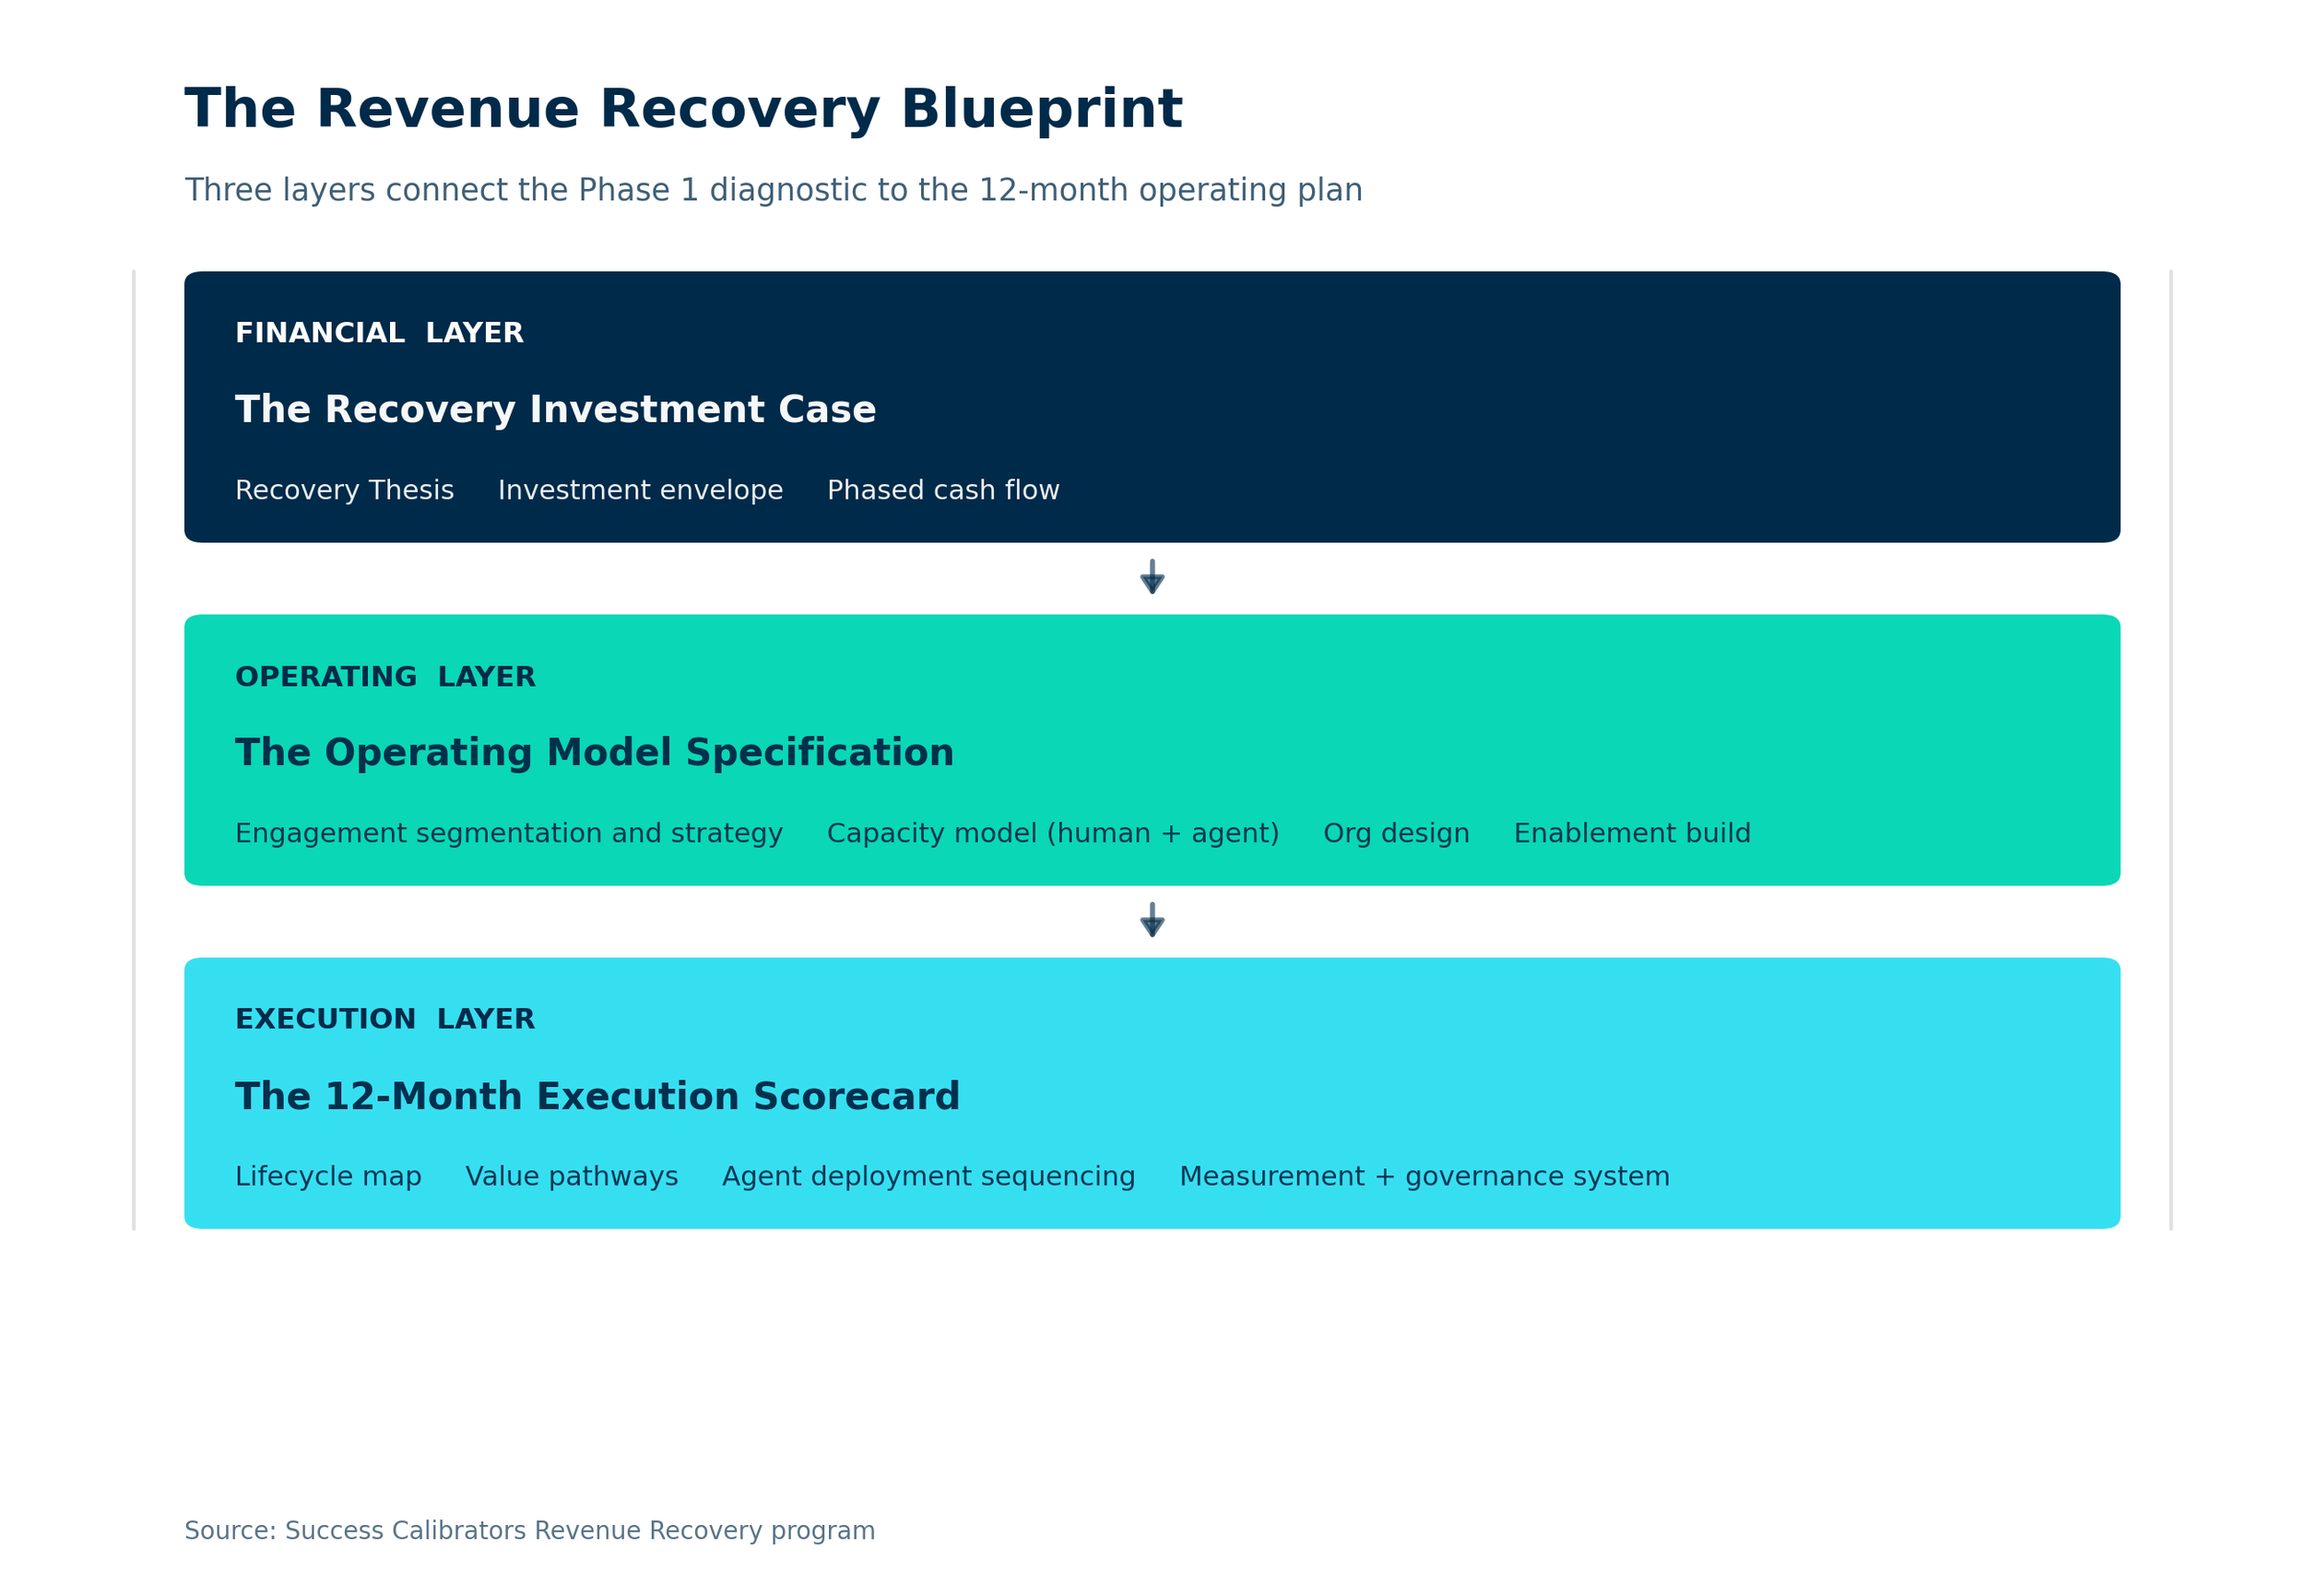
The Blueprint phase of our Revenue Recovery program converts the Phase 1 diagnostic into a structured operating plan. Three layers carry the deliverable.
The financial layer carries the Recovery Thesis forward from the diagnostic. It contains the recovery targets sequenced across Year One and projections for Years Two and Three, an investment envelope allocated across human capital, agentic capital, and operating infrastructure, phased cash flow, and the critical-path approval asks at the executive and board level. For CFOs funding customer success against a challenging internal narrative, the financial layer makes the investment case calculable, with phased cash flow and an explicit allocation envelope across human and agent investment.
The operating layer covers segmentation, capacity modeling with human-and-agent ratios, the hiring plan and sequencing, organizational design recommendations, and the customer success enablement function build. This is where most value creation plans run thin. The plan names a segmentation strategy in one sentence and a hiring number in another, then treats the build as a downstream operational exercise. The Blueprint converts segmentation into engagement architecture with specific lever assignments, converts capacity into a human-and-agent ratio per segment tier, then converts hiring into a profile specification, sequence, and ramp curve.
The execution layer specifies the lifecycle map and value pathways, the stage-specific playbook library, agent deployment sequencing, and the human-in-the-loop framework governing escalation. A 12-month implementation scorecard with leading and lagging indicators ties measurement back to recovery target attainment. The execution layer turns the financial promise into observable monthly progress, which gives the board a leading signal months before the lagging NRR number reflects the work.
Moves carry most of the recovery
The Blueprint architecture spans the full operating model. Some moves can carry most of the lift inside the first hold-period year. These shift with the company's profile, the two below tend to be consistent across companies.
The first move is onboarding redesign. Onboarding is the highest-yield setup lever in customer success because the configuration decisions made at go-live compound across every downstream interaction with the customer. Configured well, the levers don't need ongoing attention. Configured without rigor, they sit as drag on every other lever in the system and require deliberate remediation later in the relationship, at a higher cost. Most onboarding programs we audit run as a project plan with a go-live date. The Blueprint converts onboarding into a revenue lever, with configuration standards tied to the customer's revenue model and an explicit handoff into the operating cadence.
The second move is engagement segmentation with driver-and-lever mapping. Total Addressable Revenue sizing produces a ceiling number. Driver decomposition breaks the ceiling into the multiplicative operating math underneath, the small number of drivers and finite set of levers operators control to move each driver. Engagement segmentation then assigns the right levers to the right customer tiers, with capacity weighted toward the segments carrying the largest gap between current penetration and ceiling. Veronique Montreuil ran this exact play at a publicly-traded B2B platform in a prior operator role as a senior customer success and sales executive. Customers executing four of four critical behaviors performed over 20% better than customers executing three of four, which set the engagement priority across the customer base and produced a material gain against the operating plan.
These moves don't exhaust the Blueprint, they carry the largest share of Year One lift in the engagements we run, with the remaining levers, renewal and expansion operating model, agent deployment sequencing, and governance, compounding across Years Two and Three.
Why most value creation plans skip this layer
The Blueprint sits in tension with two structural features of how value creation plans get built.
The first is the 100-day clock: the standard PE post-close cadence rewards visible, fast-moving actions in the first 100 days, including price increases, cost rationalization, executive hires, and bolt-on integrations. The Blueprint requires a Phase 1 diagnostic and a structured Phase 2 design, which together run 8 to 12 weeks before the operating model rebuild begins. The 12-week window collides with the 100-day reporting expectation, and the Blueprint loses the early-cycle attention contest to the visible levers, even though it carries the largest EV lever in the plan.
The second is the competency set: PE Operating Partners carry deep playbooks on sales, finance, and product. The customer success operating model requires a different specialization, rooted in customer intelligence, revenue intelligence, and engagement strategy. The default routing is to delegate the rebuild to the in-house customer success leader, who carries the work in a silo. The work requires strong cross-functional authority and leadership-team buy-in on customer success as a company-wide muscle, with adjustments across functions to support accelerating the recovery.
Running the Blueprint puts the operating foundation in place in Year One and compounds NRR improvement through Years Two and Three, with the multiple expansion at the 110% and 120% NRR thresholds carrying the highest EV return per dollar of incremental investment in the value creation plan.
What the Blueprint commits to
The Blueprint engagement delivers three artifacts the leadership team uses immediately.
The Recovery Investment Case carries phased cash flow, the allocation envelope across human and agent capital, the critical-path approval asks, and the recovery target sequencing across the hold period. The CFO walks this to the board.
The Operating Model Specification carries the segmentation architecture, the capacity model with human-and-agent ratios, the hiring profile and sequence, the organizational design changes, and the enablement build sequence. The customer success leader executes against this.
The 12-Month Execution Scorecard carries leading and lagging indicators for every recovery lever, weekly and monthly review cadence, and escalation triggers tied to specific lever performance. The Operating Partner reviews this on the same cadence as the rest of the value creation plan.
Phase 2 runs 6 to 8 weeks following the Phase 1 diagnostic. Success Calibrators delivers structured assets the executive team uses to drive the next 12 months, with the in-house team building on a finished operating plan instead of inventing one under time pressure.
Recovery starts at the diagnostic
The Blueprint sits in Phase 2 of the Revenue Recovery program. Phase 1, the diagnostic, runs first. It quantifies Churn Tax exposure by layer, rates customer success maturity and AI maturity across our maturity model, identifies root causes and enablement gaps, maps opportunity, priorities and sequencing and produces the Recovery Thesis the Blueprint then operationalizes.
The Revenue Recovery program runs on average in a 12-month window with 75% of fees at risk against NRR improvement targets, no stop loss. The commercial structure aligns our economics with the recovery outcome, which is how a methodology-first engagement holds itself to the same standard as the value creation plan it supports.
Recovery work starts at the diagnostic, the Blueprint converts the diagnostic into the operating model the recovery requires.