
The Expansion Gap: The Growth Half of NRR Your Board Isn't Pricing

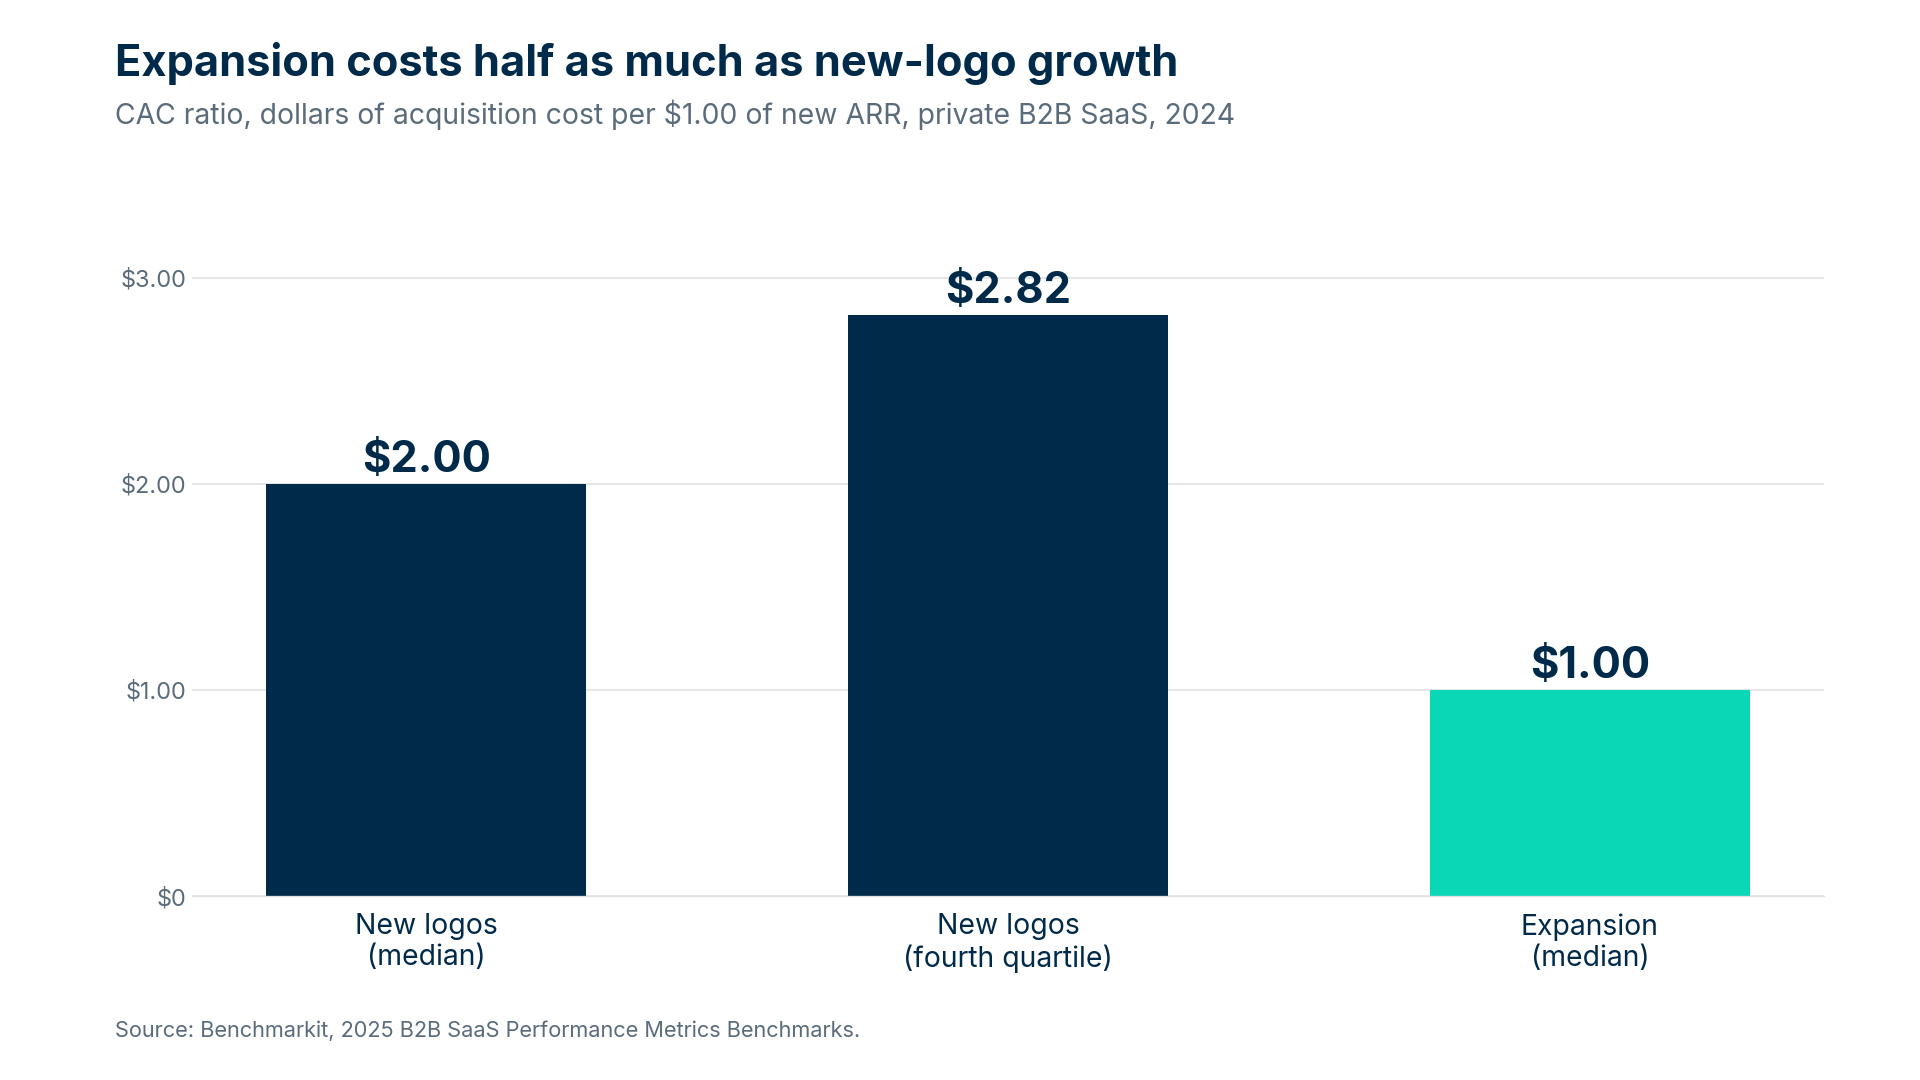
Above $50M ARR, your existing customers supply most of your new revenue. Benchmarkit's 2025 benchmarks put expansion at 58% of new ARR for companies between $50M and $100M ARR, and the cost runs at half the price of new business: an expansion CAC ratio of $1.00 per dollar of new ARR against $2.00 for new logos (Benchmarkit, 2025). The cheapest growth dollar on your P&L now carries most of the plan.
Median NRR across private B2B SaaS still sits at 101%, which means expansion at the median company covers churn and contraction with one point to spare. The expansion revenue forfeited along the way doesn't appear on any report the board reviews, we call it the Expansion Gap.
NRR has two halves
NRR equals retained ARR plus expansion, minus contraction and churn, divided by starting ARR.
On most board reports, churn shows up as a line item, a renewal forecast and a variance explanation, but sizing churn alone undercounts the exposure. The retention half carries its own hidden cost. Our Churn Tax model puts the effective cost of churn at 1.5 to 2.5x reported churn (The Churn Tax).
The growth half carries a cost too: expansion revenue your customers were ready to buy, lost to an offer made too late, too early or not at all. Your real NRR opportunity is the Churn Tax plus the Expansion Gap.
The valuation spread follows NRR
McKinsey's November 2025 analysis of B2B SaaS found top-quartile companies by valuation running NRR of 113% against 98% for the bottom quartile, with median EV-to-revenue multiples of 24x against 5x between 2019 and 2024 (McKinsey, 2025).
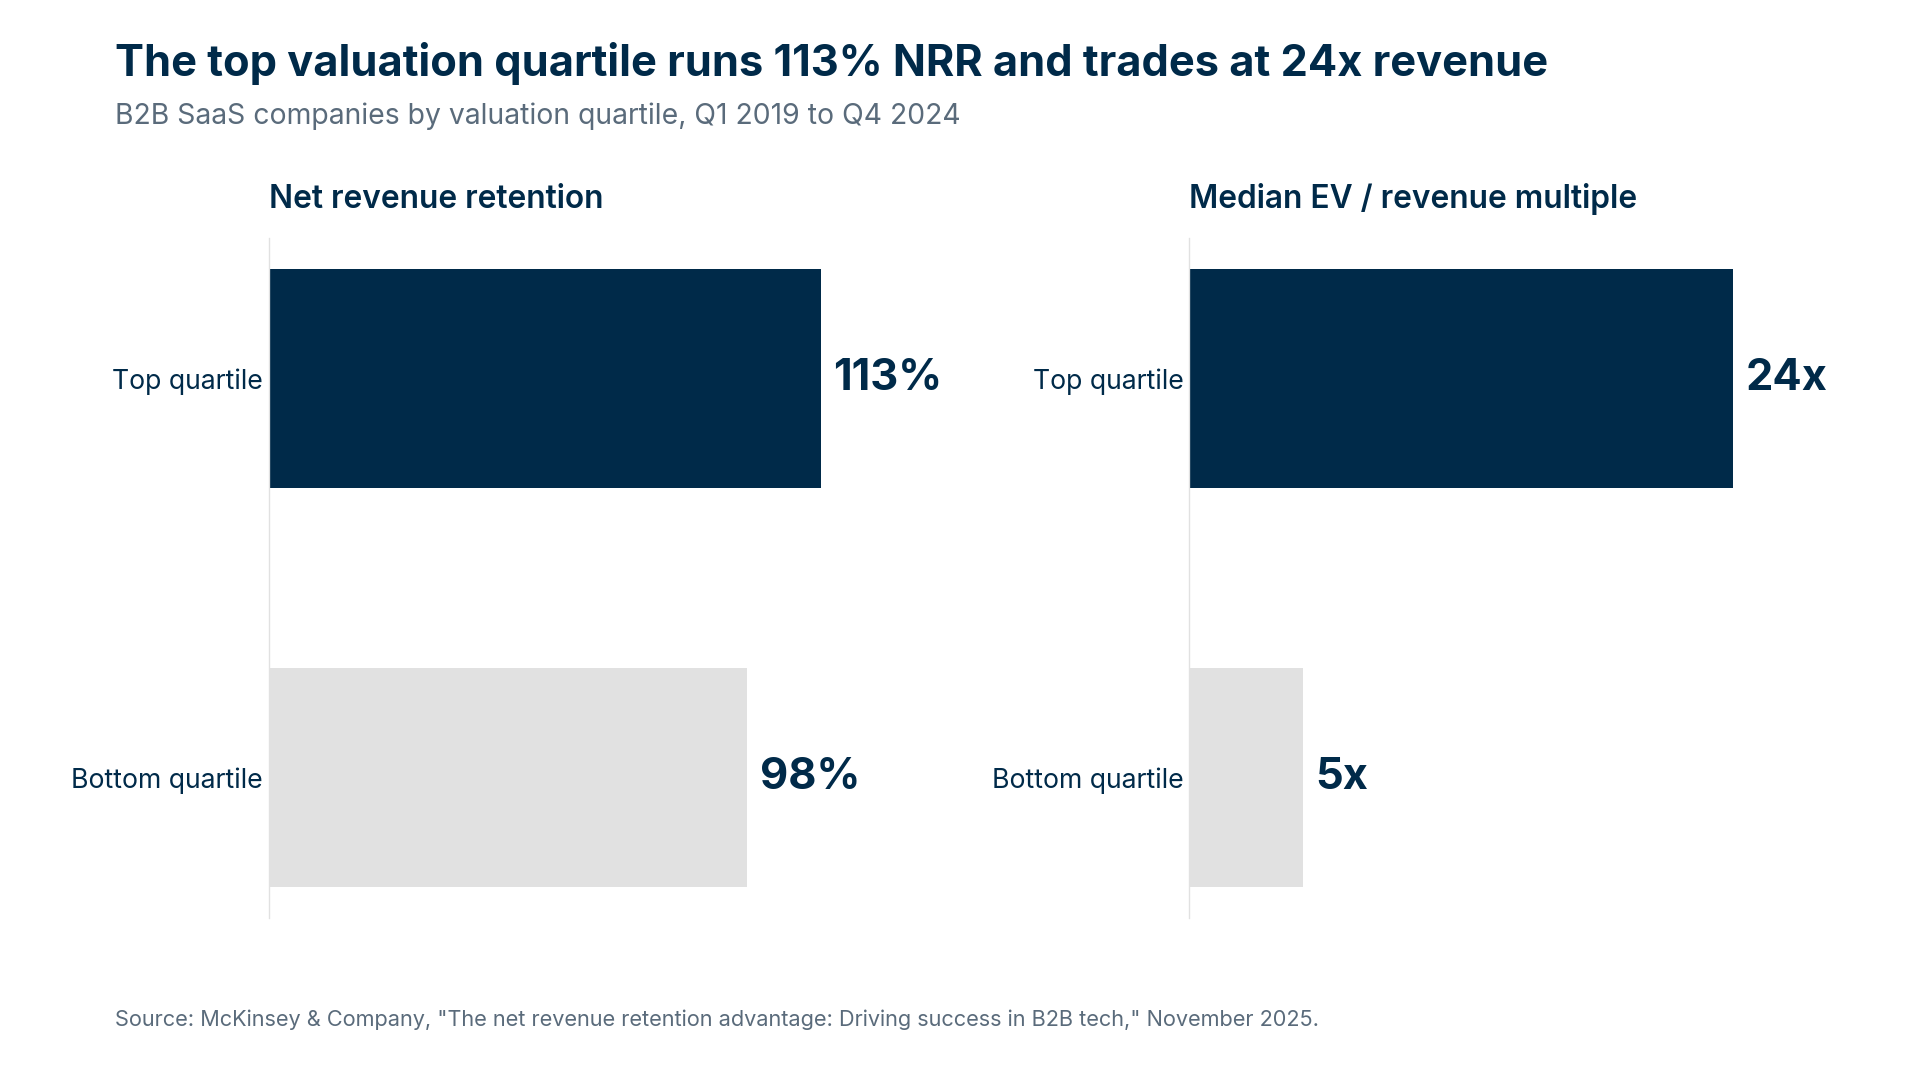
A fifteen-point NRR spread sits underneath a close to fivefold valuation spread. For a PE sponsor with a three-to-five-year hold, the expansion half of NRR is an exit-value question.
More spend hasn't closed the gap
Bain's 2024 Technology Report found NRR declining at three out of four software companies, while close to 60% of them increased customer success spending (Bain, 2024). Headcount went up and the number went down.
McKinsey's research names the structural reason: responsibility for NRR splits across leaders, with expansion under sales and retention under customer success, and no single executive owns the full number. McKinsey calls for a clear owner for each NRR component, with CEO and CFO sponsorship. Best-in-class performance management and NRR reporting correlate with NRR about 15 points higher, and the most developed value realization practices add about seven points, a level reached by 18% of the companies surveyed (McKinsey, 2025).
The pay data shows the same split: the Customer Success Collective's 2024 report found 49.1% of companies hold customer success responsible for all expansion revenue, while 36.4% of customer success professionals receive commission for it (Customer Success Collective, 2024). Responsibility, compensation and the signals predicting a purchase sit in different places.
Expansion timing depends on value the customer sees
In the model most companies run, sales triggers expansion outreach from a propensity model built without customer success input. The signals predicting whether a customer will buy more sit elsewhere.
We assess expansion readiness on four triggers. Two of them lead: depth, the customer's adoption and usage of what they bought, and momentum, where the customer stands against the milestones tied to the outcome they paid for. Both measure value realization, and both sit with the customer success team. The other two reflect the customer's own business: growth, and the strategic planning windows when the customer sets next year's budget. Customer success and sales both surface these through their conversations with the account.
Value realization alone doesn't open the budget. The customer also has to recognize the value, and be able to defend it inside their own organization. Harvard Business Review documented this gap in August 2026, describing B2B companies whose customers benefit from the product but struggle to see, measure and defend the value inside their own organization, with stalled renewals, pricing pressure and lost growth as the result (HBR, 2026). Recognition doesn't appear in product data, the customer success team sees it, builds it and reinforces it, and a model without their input misses it.
From a propensity score to a growth engine
A propensity model answers one question: which accounts look likely to buy. Closing the Expansion Gap takes a second question: which action moves a specific account toward readiness, and who runs it.
We call the answer a Next-Best-Action engine. For an account short of readiness, the engine prescribes a development play aimed at the weakest leading signal, run by customer success. For an account at readiness, customer success opens the expansion conversation and creates the opportunity, timed to the customer's planning window. Sales doesn't call a ready customer out of the blue, and where sales closes the deal, it picks up from the conversation customer success started. Customer success plays a role in each expansion, whether sales closes the deal depends on deal complexity, a product-led or sales-led motion, the customer segment and the contract structure, and the model holds either way, because both teams work from the same view of readiness, so expansion pipeline gets built ahead of the commercial conversation instead of discovered after it.
The model holds up in operation. Before founding Success Calibrators, Veronique Montreuil's teams built this engine at a multi-product SaaS company, where upsells generated by the engine lifted closed upsell and cross-sell revenue more than 50%. At a usage-based revenue platform, her team mapped the drivers of revenue growth, including active accounts, buyers per account and revenue per buyer, built the engine around the levers moving them, and revenue generated exceeded goal by 67%.
The timeline your board should expect
Rebuilding the expansion motion is structural work, the data foundation, the shared view of readiness and the library of development plays take time to build, and meaningful movement in retention and expansion takes 3 to 4 quarters at minimum, often 5 to 6. Contract length drives the lag, and product-led businesses with shorter cycles move faster. Early wins appear in the first quarters, the NRR improvement compounds after.
For a sponsor underwriting a hold period, the math favors starting early. Each year the Expansion Gap stays open, the company buys growth at $2.00 of acquisition cost per dollar of new ARR when part of it was available at $1.00 from customers already on the books.
Size both halves before you fund the fix
Our Revenue Success diagnostic phase identifies the root causes of revenue leakage, sizes the full NRR opportunity, assesses the current state of your customer success motion across the seven dimensions of our maturity model, including AI maturity, quantifies Churn Tax exposure by layer, sets the opportunities, priorities and sequencing for the work ahead, and projects the NRR improvement.
If expansion carries most of your growth plan and your NRR sits near the median, the Expansion Gap belongs on the board agenda next to churn.